


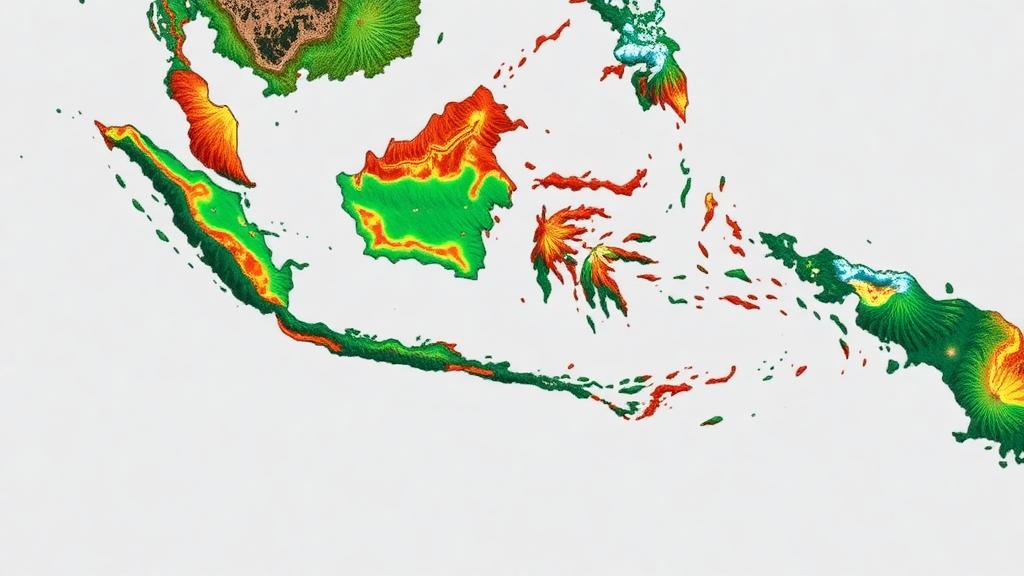
Deep beneath the swamp forests of Rupat Island, off the eastern coast of Sumatra, lies one of the planet’s most concentrated stores of carbon. Peatlands cover only a few percent of Earth’s land surface, yet they hold an estimated 450 to 650 petagrams of carbon, more than all the world’s forests combined. Indonesia alone contains roughly 36 petagrams of carbon in its peat, about six to eight percent of the global peat carbon stock. When these waterlogged soils are drained for plantations and agriculture, the water table drops, oxygen floods into the peat, and microbes begin devouring organic matter that has been locked away for millennia. The result is a slow-motion carbon bomb that scientists have struggled to measure with any real precision.
A new study published in Environmental Advances offers a strikingly detailed view of this process. Researchers led by Waluyo Yogo Utomo combined machine learning with an unusually dense network of field measurements to map groundwater levels across an entire peat hydrological unit on Rupat Island at a resolution of 10 meters, updated every two weeks, spanning 2019 to 2025. They then converted those water table maps into carbon dioxide emission estimates using a newly fitted response curve built from nearly a hundred chamber measurements across Indonesian peatlands. The approach, the authors argue, could replace the static, land-use-based emission factors that currently dominate national greenhouse gas accounting with something far more responsive to climate reality.
The scale of the data collection is itself remarkable. The team drew on 134 automatic loggers and manual dipwells installed across the Rupat Island peat hydrological unit, a landscape of roughly 118,500 hectares containing two peat domes up to 12 meters deep. To anchor the model in permanently saturated zones, they added 40 dummy points along estuarine and coastal margins. In total, the dataset comprised 16,496 biweekly water level records. These were paired with an arsenal of satellite-derived predictors: rainfall from CHIRPS, evapotranspiration from MODIS, radar backscatter from Sentinel-1 as a proxy for soil moisture, and a suite of static variables including peat thickness, lidar-derived elevation, slope, flow accumulation, topographic wetness, and distances to canals, rivers, and the coast.
The algorithm at the heart of the study is Extreme Gradient Boosting, or XGBoost, a tree-based machine learning method prized for its speed and accuracy on tabular data. After screening 47 candidate predictors down to 33 to eliminate multicollinearity, the team trained the model on 70 percent of the records and validated it on the remaining 30 percent. The results were strong: the calibrated model explained 79 percent of the variance in water level with a root mean square error of 7.5 centimeters, while independent validation achieved 73 percent explanatory power and an error of 8.3 centimeters. Repeated Monte Carlo cross-validation confirmed that the performance was stable rather than a statistical fluke.
Perhaps most illuminating is what the model learned about its own decisions. Using SHAP analysis, a technique borrowed from game theory that assigns each predictor an additive contribution to every prediction, the researchers found that filled surface elevation was the single most important driver of water table depth, followed by distance to the coast and antecedent climate conditions. Years with pronounced drought, notably 2020 and 2022, also carried substantial weight. In other words, the shape of the land and the memory of past rainfall matter more for peatland hydrology than any single snapshot of weather, a finding that echoes the physical intuition of peat scientists but had rarely been quantified at this scale.
The mapped water tables revealed a landscape under quiet stress. Average water levels across the unit sat at about 36 centimeters below the surface, within Indonesian regulatory limits, but spatial differences reached 30 to 60 centimeters. Drained plantation areas on the coastal backswamps plunged to depths of 45 to 60 centimeters during dry years, while undrained forest remnants, squeezed into small patches at the domes’ centers, showed water tables of 30 to 40 centimeters, deeper than comparable undrained forests elsewhere in Sumatra and Kalimantan. The authors suggest these forest islands are hydrologically hostage to the drained plantations surrounding them, a sobering illustration of how drainage infrastructure reshapes entire landscapes.
To translate water depth into carbon, the team systematically reviewed 32 closed-chamber studies across Indonesian peatlands, distilling 97 observations of soil respiration and heterotrophic respiration, the component that represents genuine peat decomposition rather than root activity. Fitting a Gompertz, or sigmoidal, function to these data produced a markedly better description of the emission-water table relationship than the linear models used in earlier compilations, with explanatory power of 22 to 24 percent versus just 4 to 5 percent previously. The curve captures a crucial nonlinearity: emissions respond sharply to water table changes between 0 and 60 centimeters below the surface, but flatten out when peat is fully inundated or desiccated beyond microbial tolerance.
Upscaling the response curve across the biweekly water maps yielded striking totals. The Rupat Island unit emitted an average of 52.1 megagrams of carbon dioxide per hectare per year as soil respiration, of which about 42 megagrams came from heterotrophic peat oxidation, a ratio of roughly 0.80 consistent with prior studies. Across the whole landscape, that amounts to 4.44 million tonnes of carbon dioxide per year from soil respiration and 3.55 million tonnes from peat decomposition alone, or 31.1 and 24.8 million tonnes cumulatively over the study period. Emissions peaked during the dry early months of 2020, when rainfall hit long-term minima and water tables plunged, and simulations showed that a dramatic drawdown from 0 to 80 centimeters below the surface could inflate emissions by nearly 200 percent.
The asymmetry embedded in the response curve carries a hard policy lesson. A 10-centimeter drop in the water table from 40 to 50 centimeters deep produces a larger emission increase than the reduction achieved by raising it back from 50 to 40 centimeters. Drainage, in other words, is far easier to cause than to undo, and short-term rewetting cannot fully compensate for drying episodes. The study’s estimates also diverged from the static benchmarks: IPCC Tier 1 emission factors produced the lowest heterotrophic emission figures, about 88 percent of the new estimate, while Indonesia’s forest reference level and earlier linear models produced higher ones. The differences widen cumulatively over time, meaning national inventories built on static factors may systematically misjudge both the magnitude and the timing of peat carbon losses.
The authors are candid about limitations. Dipwell networks remain sparse in inaccessible swamp interiors, the chamber studies are unevenly distributed across land uses, and the estimates exclude fire emissions, methane, nitrous oxide, and carbon exported through rivers. Extrapolating the Rupat model nationally would introduce substantial uncertainty, since the algorithm learned site-specific relationships between canals, topography, and climate. Yet the framework points clearly toward a future in which emission factors are dynamic, localized, and sensitive to the El Niño cycles and climate variability that increasingly govern tropical peat hydrology. As monitoring networks expand and the method is validated across other peat hydrological units, it could give Indonesia, and the world, a far sharper instrument for tracking one of the largest and most vulnerable carbon reservoirs on Earth.
Subject of Research: Machine learning-based estimation of groundwater level and carbon dioxide emissions in Indonesian tropical peatland
Article Title: MACHINE LEARNING-AIDED GROUNDWATER LEVEL AND CO 2 EMISSION ESTIMATIONS IN INDONESIAN TROPICAL PEATLAND
Article References: Utomo, W. Y., Aini, F. K., Askary, M., Anwar, S., Tarigan, S. D., & Barus, B. (2026). MACHINE LEARNING-AIDED GROUNDWATER LEVEL AND CO2 EMISSION ESTIMATIONS IN INDONESIAN TROPICAL PEATLAND. Environmental Advances, Article 100762. https://doi.org/10.1016/j.envadv.2026.100762
Image Credits: AI Generated
DOI: 10.1016/j.envadv.2026.100762
Keywords: tropical peatland, groundwater level, carbon dioxide emissions, machine learning, XGBoost, Indonesia, peat decomposition, emission factors, remote sensing, SHAP analysis, Rupat Island, carbon accounting
Cite Scienmag News
Sloane Callahan. (October 5, 2026). AI Maps Hidden Water Loss and Carbon Emissions Across Indonesian Tropical Peatland. Scienmag. https://scienmag.com/ai-maps-hidden-water-loss-and-carbon-emissions-across-indonesian-tropical-peatland/
Sloane Callahan. "AI Maps Hidden Water Loss and Carbon Emissions Across Indonesian Tropical Peatland." Scienmag, 5 October 2026, https://scienmag.com/ai-maps-hidden-water-loss-and-carbon-emissions-across-indonesian-tropical-peatland/. Accessed 5 October 2026.
Sloane Callahan. "AI Maps Hidden Water Loss and Carbon Emissions Across Indonesian Tropical Peatland." Scienmag. October 5, 2026. https://scienmag.com/ai-maps-hidden-water-loss-and-carbon-emissions-across-indonesian-tropical-peatland/


