

When a heat wave settles over a city, the difference between a sweltering afternoon and a bearable one can come down to a single row of mature trees casting shade across a stretch of sidewalk. Yet most municipalities still plan their urban forests with blunt instruments: citywide canopy targets, expressed as a single percentage, that treat every neighbourhood as though it were the same. A pair of new studies from researchers at the University of British Columbia argues that this approach wastes both money and cooling potential, and it offers a way to replace broad targets with block-by-block decisions grounded in satellite data, shade modelling and equity analysis.
The research, tested in the fast-growing city of Kelowna, British Columbia, combines two complementary tools. The first sharpens freely available satellite thermal imagery to a resolution fine enough to reveal hot spots the size of a large residential lot. The second, a modelling framework called CanopyFit, maps where new trees can realistically be planted and where their shade would deliver the greatest benefit to the people most exposed to heat. Together, the tools move urban forestry from the scale of the whole city to the scale of the street, where heat is actually experienced by pedestrians, cyclists and residents without air conditioning.
Dr. Melissa McHale, a professor in UBC’s Faculty of Forestry and Environmental Stewardship and senior author on both studies, framed the problem in terms of decision-making rather than ambition. Cities often know they need more tree canopy, she noted, but they still have to decide exactly where planting is possible and where shade will make the greatest difference. In her view, the two approaches together shift planning from broad citywide targets toward decisions at the scale of the streets and neighbourhoods where people actually live with the heat. That distinction matters because shade is not a uniform commodity: a tree cooling a busy transit stop or a schoolyard delivers benefits that a tree in a low-traffic park corner may never match.
The first study, published in the journal Remote Sensing, tackles a technical limitation that has long constrained municipal heat mapping. Satellite thermal sensors such as those aboard Landsat provide surface temperature data at a resolution of roughly 30 metres per pixel, while the European Sentinel-2 mission offers finer optical imagery but no thermal band. At 30 metres, a single pixel can blend the temperatures of rooftops, asphalt, lawns and tree canopy into one averaged value, smearing away exactly the small-scale temperature contrasts that matter for planning. A parking lot adjacent to a shaded playground can disappear entirely into a single lukewarm reading.
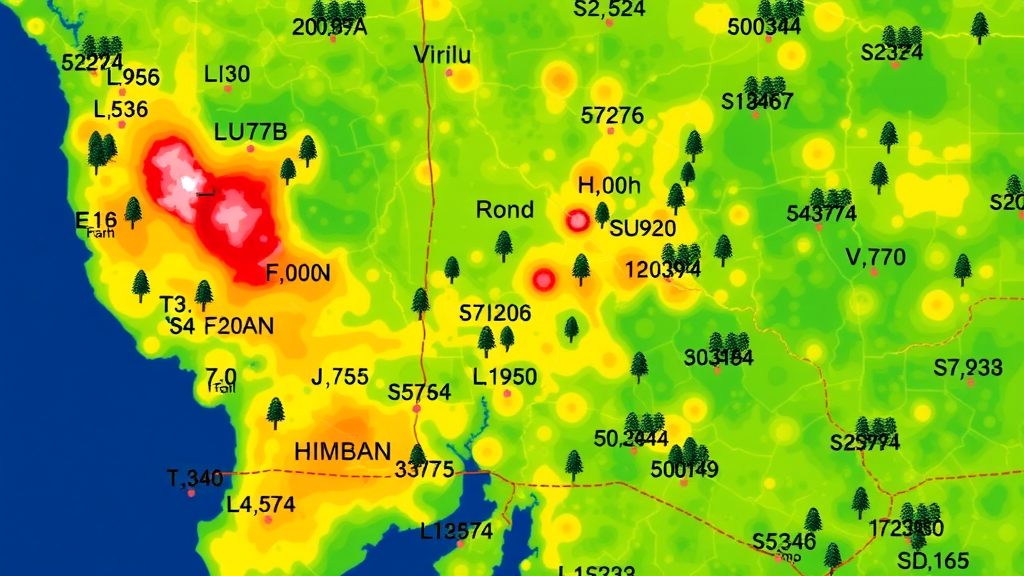
To overcome this, the UBC team tested an open-source machine-learning technique that fuses thermal data from Landsat with higher-resolution imagery from Sentinel-2, producing temperature maps sharpened to 10-metre resolution. The results were striking. Across Kelowna, the higher-resolution maps revealed nearly five times as much temperature variation as conventional imagery. With 30-metre pixels, hot spots appeared as broad zones averaging 18,000 square metres, an area roughly equivalent to two and a half Canadian football fields. The 10-metre approach detected hot spots as small as 700 square metres, about the footprint of a large residential lot, allowing planners to see precisely which courtyards, parking strips and street segments run hottest.
A critical question for any downscaled product is whether the added detail reflects real landscape differences or simply digital artefacts introduced by the algorithm. The researchers addressed this by testing how much of the new temperature variation could be explained by features visible on the ground. Tree canopy and paved surfaces accounted for more than 65 per cent of the additional temperature detail, a strong indication that the sharpened maps were capturing genuine landscape structure rather than noise. The authors are careful to note that surface temperature is not the same as air temperature; a hot asphalt surface does not translate directly into the air temperature a pedestrian feels. Even so, because the technique relies on freely available satellite data and open-source tools, it offers cities a low-cost way to identify small hot spots that conventional mapping misses entirely.
Finding the heat, however, is only half the problem. The second study, published in Urban Forestry & Urban Greening, confronts a harder constraint: not every hot neighbourhood has room for trees. CanopyFit, a modelling approach conceived and spearheaded by Dr. McHale and developed collaboratively with her Urban Ecology and Sustainability Lab and municipal partners, maps practical planting potential by first excluding areas where trees cannot go. Buildings, sports fields, underground utility corridors, wildfire buffer zones and environmentally sensitive ecosystems are all screened out before the model assesses what remains. It then weighs the remaining planting space against heat exposure and social and economic need, producing a prioritized picture of where new canopy would deliver the most value.
Applied across Kelowna, the model identified space for 248 hectares of potential new mature canopy, a substantial figure for a mid-sized city. But the distribution was highly uneven. Just 20 per cent of the analyzed area accounted for more than half, 50.8 per cent, of all potential shade gains. That concentration is the analytical heart of the research: if planting resources are finite, directing them toward a small fraction of the urban landscape can capture the majority of the achievable cooling. It also means that a uniform citywide canopy target, spread evenly across all neighbourhoods, would leave most of the practical opportunity unrealized.
The analysis further shows that different neighbourhoods require different solutions. Some areas emerge as win-win zones, where high heat and equity needs coincide with ample planting space, marking locations where additional trees could deliver particularly large combined benefits. Others face high heat and greater need but have little room for new trees, a common condition in dense commercial corridors and older neighbourhoods built around wide asphalt surfaces. In those places, the researchers suggest, cities should consider alternatives such as removing asphalt, changing development rules to require setbacks and permeable surfaces, or installing engineered shade structures. The point is not that trees are the only answer, but that knowing where trees cannot fit forces planners to confront the built environment itself as a heat problem.
Because both tools rely on adaptable frameworks and widely available data, the researchers argue that municipalities elsewhere can combine them with local information to develop their own heat-reduction strategies. Landsat and Sentinel-2 imagery is free to any city with an internet connection, and the screening criteria in CanopyFit can be adjusted to reflect local utility maps, wildfire risk and ecological constraints. For cities with limited space and resources for planting, as Dr. McHale put it, the goal is to establish and sustain large, healthy trees where their cooling and other benefits are needed most. Where the built environment leaves little room for trees, the findings can help cities identify the barriers to planting and assess other approaches to providing shade. In an era when urban heat is intensifying and municipal budgets are stretched, that shift from aspiration to precision may prove to be the most valuable thing these studies plant.
Subject of Research: Targeted urban tree planting for heat mitigation using high-resolution satellite thermal mapping and shade equity modelling in Kelowna, British Columbia
Article Title: New tools pinpoint where urban trees could provide the most relief from heat
Article References: New tools pinpoint where urban trees could provide the most relief from heat. (n.d.). Original publication
Image Credits: AI Generated
DOI: Not provided
Keywords: urban heat, tree canopy, satellite thermal mapping, Landsat, Sentinel-2, machine learning, shade modelling, heat equity, urban forestry, Kelowna, CanopyFit, climate adaptation
Cite Scienmag News
Alan Morgan. (September 25, 2026). High-Resolution Heat Maps and Shade Modelling Show Cities Where Tree Planting Cools Most. Scienmag. https://scienmag.com/high-resolution-heat-maps-and-shade-modelling-show-cities-where-tree-planting-cools-most/
Alan Morgan. "High-Resolution Heat Maps and Shade Modelling Show Cities Where Tree Planting Cools Most." Scienmag, 25 September 2026, https://scienmag.com/high-resolution-heat-maps-and-shade-modelling-show-cities-where-tree-planting-cools-most/. Accessed 25 September 2026.
Alan Morgan. "High-Resolution Heat Maps and Shade Modelling Show Cities Where Tree Planting Cools Most." Scienmag. September 25, 2026. https://scienmag.com/high-resolution-heat-maps-and-shade-modelling-show-cities-where-tree-planting-cools-most/


