


On the vast high-altitude expanse of the Qinghai-Tibetan Plateau, often called the Third Pole, vegetation has long been regarded as a sensitive barometer of climate change. Now a new study published in Climate Dynamics has delivered one of the most detailed quantitative assessments to date of how strongly the plateau’s plant life responds to drought, and the findings point to a troubling trajectory. Analyzing more than three decades of satellite-derived vegetation data alongside reconstructions of climatic water balance, researchers led by Ning Yuan of Sichuan University and the Nanjing Hydraulic Research Institute found that the sensitivity of vegetation to drought across the plateau increased steadily between 1982 and 2015, rising at a rate of 0.024 per year over the whole study period. That trend, the authors argue, is driven primarily by warming itself, and it implies that the plateau’s ecosystems will become progressively more vulnerable to drought stress as the twenty-first century unfolds.
The Qinghai-Tibetan Plateau is an ecologically fragile region of enormous importance. Covering roughly 2.5 million square kilometers at average elevations above 4,000 meters, it hosts alpine grasslands and meadows that sustain pastoral communities, regulate the headwaters of major Asian rivers including the Yangtze, Yellow, and Mekong, and interact closely with the monsoon systems of southern Asia. Because the plateau has warmed at rates substantially faster than the global average, it serves as a natural laboratory for studying how cold, high-altitude ecosystems react when atmospheric demand for water intensifies. Yet, despite extensive previous research on vegetation greening, phenology, and drought impacts in the region, the question of how strongly vegetation responds to drought, and which climatic variables control that response, had remained poorly resolved.
To address this gap, the research team assembled two complementary long-term datasets. The first was the normalized difference vegetation index, or NDVI, obtained from the GIMMS NDVI 3g product, which derives from Advanced Very High Resolution Radiometer observations aboard NOAA satellites and provides a consistent record of vegetation greenness from 1981 onward. NDVI exploits the fact that healthy, photosynthetically active vegetation absorbs red light and reflects near-infrared radiation, so changes in the ratio between these two spectral bands track changes in canopy density and productivity. The second dataset was the standardized precipitation evapotranspiration index, or SPEI, a drought metric computed from the balance between precipitation and the water lost to the atmosphere through evaporation and plant transpiration. Unlike precipitation-only indices, SPEI explicitly accounts for the amplifying effect of rising temperatures on evaporative demand, making it well suited to diagnosing drought under a warming climate. By comparing temporal fluctuations in NDVI and SPEI at each location across the plateau from 1982 to 2015, the team computed a local measure of vegetation sensitivity to drought: how much greenness changes for a given departure of drought conditions from the norm.
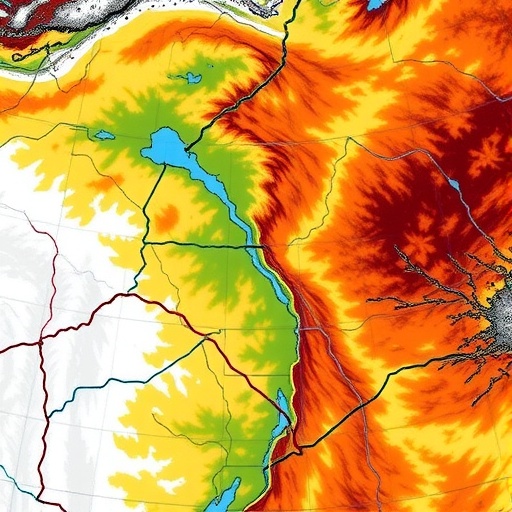
The spatial pattern that emerged was strikingly heterogeneous. Sensitivity was markedly higher in the southern portion of the plateau than in the north, a contrast the authors attribute to differences in moisture regimes, vegetation type, and thermal conditions. Southern regions, which receive more monsoon-influenced precipitation and support lusher alpine meadows and shrublands, respond more visibly when water becomes scarce, whereas the colder, more arid northern zones exhibit comparatively muted responses. This north-south gradient matters for conservation and land management, because it identifies the plateau’s southern grasslands as the regions where a given intensification of drought will translate most immediately into vegetation loss, reduced forage availability, and heightened risk of degradation.
Beyond mapping the pattern, the study’s central contribution lies in disentangling the mechanisms behind the observed increase in sensitivity. The researchers deployed two complementary statistical frameworks. The first was the geographical detector model, a spatial analysis technique designed to quantify how much of the spatial heterogeneity in a variable, here drought sensitivity, can be explained by stratifying the landscape according to potential explanatory factors. The geographical detector approach compares the within-stratum variance of the response variable with its total variance to derive an explanatory power, denoted q, for each factor, and it also detects interactions between factors. The second framework was a structural equation model, or SEM, a form of path analysis that allows researchers to test a network of hypothesized causal relationships among observed variables, estimating direct and indirect pathways simultaneously. Used together, these tools permitted the team not only to rank the importance of candidate drivers but also to examine how they combine and interact.
The factors examined included temperature, precipitation, vapor pressure deficit, or VPD, soil moisture, solar radiation, wind speed, atmospheric carbon dioxide concentration, and elevation-related variables. The analysis converged on a clear hierarchy. Sensitivity of vegetation to drought was mainly attributed to temperature, precipitation, and VPD, with temperature exerting the largest single influence. When the team separated and quantified the independent contributions of the primary factors using deliberately designed scenarios, they found that temperature accounted for roughly 40 percent of the contribution to drought sensitivity, precipitation about 32 percent, and VPD the remaining 28 percent. In other words, thermal conditions, both directly and through their effects on atmospheric dryness, dominated the sensitivity landscape, overshadowing the role of water supply alone.
This result carries an important physical interpretation. As air temperature rises, the saturation vapor pressure of air increases exponentially, which, unless relative humidity rises in step, widens the vapor pressure deficit, the gap between how much water vapor air could hold and how much it actually holds. A larger VPD steepens the gradient driving water out of leaves through stomata, forcing plants either to lose more water or to close their stomata and curtail photosynthesis. Under elevated VPD, the same rainfall shortfall therefore produces a more severe physiological drought, and vegetation greenness responds more dramatically. Earlier global analyses have documented this dynamic, including findings that increased atmospheric vapor pressure deficit reduces global vegetation growth, and the new plateau-scale study shows that this mechanism is now a leading controller of drought response in one of the world’s most climate-stressed mountain regions.
The scenario-based quantification also helps resolve a lingering tension in the literature. Some previous global and regional studies reported that vegetation sensitivity to drought was weakening, potentially because rising atmospheric carbon dioxide allows plants to use water more efficiently, or because decoupling between vegetation and climate has grown. Others, examining global vegetation productivity or water-limited ecosystems, reported increasing sensitivity over recent decades. The new results place the Qinghai-Tibetan Plateau firmly in the latter category: warming on the plateau is so rapid that it overwhelms any moderating influence, pushing vegetation into a regime where drought stress registers ever more strongly in greenness. The authors note that the sensitivity increase of 0.024 per year over 1982 to 2015 reflects this warming-driven trajectory, and they caution that the sensitivity of vegetation to drought will be further exacerbated under future global warming.
The implications extend well beyond the plateau’s borders. The region’s vegetation underpins the water yield of river basins serving nearly two billion people downstream, and any weakening of vegetation cover through drought-induced degradation can alter albedo, soil stability, permafrost thermal regimes, and regional carbon cycling. Alpine grasslands on the plateau also support traditional pastoral economies, and increased sensitivity means that drought episodes of a given meteorological magnitude will now deliver larger ecological and livelihood impacts than they did three or four decades ago. From a management perspective, the finding that temperature, rather than precipitation alone, is the dominant driver suggests that adaptation strategies cannot rely on water supplementation alone but must account for heat stress and atmospheric dryness, for example through grazing adjustments timed to vegetation condition and monitoring systems that integrate thermal and VPD indicators alongside rainfall.
Methodologically, the study demonstrates the value of combining remote sensing indices with multi-model causal attribution. Using GIMMS NDVI 3g ensures a record long enough to capture interannual and decadal variability, while SPEI at appropriate time scales captures the water-balance stress that plants actually experience. The combination of the geographical detector model, which excels at spatial heterogeneity attribution, and structural equation modeling, which excels at quantifying directed pathways among covarying variables, allowed the team to separate correlation from plausible causation in a system where temperature, precipitation, VPD, and soil moisture are deeply intertwined. The scenario designs that held other factors fixed while varying each primary driver further provided independent contribution estimates, a step often missing in purely correlative studies of vegetation-climate relationships.
The study draws on publicly available datasets, including the GIMMS NDVI 3g archive maintained by the National Center for Atmospheric Research climate data guide, the China Meteorological Forcing Dataset for precipitation, temperature, wind speed, and shortwave radiation, ERA5-Land reanalysis soil moisture from the Copernicus Climate Change Service, a vapor pressure deficit dataset from the Climatology Lab, potential evaporation data from Geodata, and greenhouse gas emissions data from the EDGAR database. The work was supported by the National Natural Science Foundation of China and related programs, and the corresponding authors are Wensheng Wang of Sichuan University and Xiaojun Wang of the Nanjing Hydraulic Research Institute. As the Third Pole continues to warm at an accelerating pace, the message of this research is unambiguous: the plateau’s vegetation is not merely experiencing drought more often, it is becoming intrinsically more reactive to drought, and the pace of that transformation is set by the thermometer as much as by the rain gauge.
Cite Scienmag News
Sloane Callahan. (September 8, 2026). Drought sensitivity of vegetation rises with warming on Tibetan Plateau. Scienmag. https://scienmag.com/drought-sensitivity-of-vegetation-rises-with-warming-on-tibetan-plateau/
Sloane Callahan. "Drought sensitivity of vegetation rises with warming on Tibetan Plateau." Scienmag, 8 September 2026, https://scienmag.com/drought-sensitivity-of-vegetation-rises-with-warming-on-tibetan-plateau/. Accessed 8 September 2026.
Sloane Callahan. "Drought sensitivity of vegetation rises with warming on Tibetan Plateau." Scienmag. September 8, 2026. https://scienmag.com/drought-sensitivity-of-vegetation-rises-with-warming-on-tibetan-plateau/


