


Composite indices are everywhere: they compress poverty, health, education, housing, demographics, and other complex realities into a single score that can be ranked, mapped, and communicated to policymakers. But that convenience comes with a difficult trade-off. Reducing dozens of measurements to one number can conceal important relationships, allow one indicator to dominate another, or impose assumptions about how different forms of disadvantage should compensate for one another. A new study in Social Indicators Research proposes a machine-learning alternative. Developed by statisticians Giulio Grossi and Emilia Rocco at the University of Florence, the method, called AutoSynth, uses an autoencoder—a type of neural network originally designed to learn compressed representations of data—to build synthetic socioeconomic indices. The researchers tested the method on suburban areas of Florence and on thousands of counties in the United States, arguing that it can preserve more of the structure contained in multidimensional datasets than conventional approaches.
The central idea behind AutoSynth is technically simple but potentially powerful. An autoencoder receives an input matrix in which rows represent geographical areas and columns represent indicators. For the Florence study, the columns include measures such as income, poverty, population ageing, natural population change, depopulation, housing tenure, elderly people living alone, single-parent households, educational attainment, and vacant dwellings. The network first compresses each row into a much smaller latent representation, known as the code, and then attempts to reconstruct the original indicators from that code. If the code consists of a single value, that value becomes the synthetic index. During training, the system adjusts its internal weights to minimise the difference between the original data and the reconstructed data, generally using a Euclidean-distance-based loss. In mathematical terms, the encoder maps the input vector (X) to a latent value (Y), while the decoder maps (Y) back to an approximation of (X). The better the reconstruction, the more information the compressed index is judged to retain.
Unlike a standard arithmetic mean, AutoSynth does not simply assume that every indicator contributes in a fixed and transparent proportion. Unlike principal component analysis, or PCA, it is designed to capture nonlinear relationships among variables. PCA searches for a linear combination of indicators that preserves as much variance as possible. Autoencoders can instead use layers of nonlinear activation functions, allowing the latent score to respond differently when indicators interact. For example, a high proportion of elderly residents might have a different meaning in a wealthy, well-educated neighbourhood than in an area with low incomes, empty homes, and weak social services. The authors argue that this capacity to model interactions distinguishes AutoSynth from other nonlinear techniques such as categorical principal component analysis, which generally transforms individual variables but combines them additively. In AutoSynth, the entire indicator vector is processed jointly, allowing the model to learn more complex configurations.
Before training, the researchers rescaled their indicators using the adjusted Mazziotta–Pareto convention, transforming each variable to a range between 70 and 130. This step prevents indicators measured in different units from overwhelming one another simply because of their numerical scale. Variables whose direction was opposite to vulnerability were reversed, so that higher values consistently indicated worse conditions. The network used rectified linear unit, or ReLU, activation functions, which return zero for negative inputs and preserve positive values. The method also permits researchers to introduce expert-defined input weights, giving selected indicators greater influence before the neural network begins its optimisation. In the Florence and U.S. applications, however, the authors used equal input weights and set the bias vector to zero, leaving the main structure to be learned from the data.
The Florence case study was designed to measure what the researchers call the Socio-Economic and Demographic vulnerability Index, or SEDI, across suburban units of the city. The framework focuses on “inherent vulnerability”: the social and economic conditions that can limit a community’s ability to cope with hardship. It does not attempt to measure exposure to floods, heat, pollution, or other environmental hazards. The three domains were economic, demographic, and social. Economic vulnerability included relative poverty, income, and the proportion of residents who rent rather than own their homes, the latter treated as a proxy for lower accumulated wealth in a country where homeownership is widespread. Demographic vulnerability incorporated ageing, low birth rates, and population decline. Social vulnerability included elderly residents living alone, minors in single-parent families, minors from foreign-origin households, educational attainment, and unused housing. Most data referred to 2021, although education and vacant housing measures came from the 2011 census.
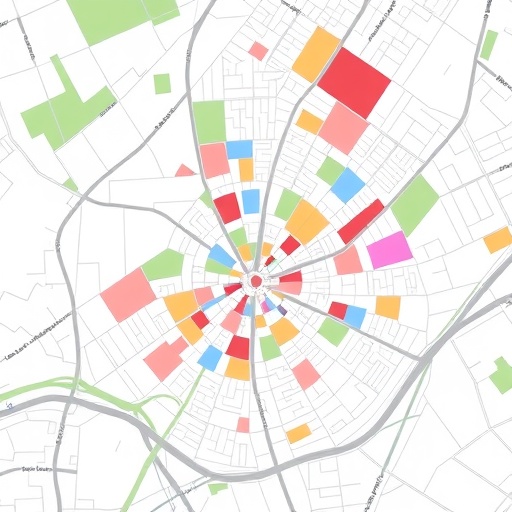
The analysis covered 74 relatively homogeneous suburban units, positioned between small census areas and Florence’s larger administrative districts. The resulting SEDI scores were compared with two established alternatives: the adjusted Mazziotta–Pareto Index, or AMPI, and a PCA-based index. Because neural-network training depends on random starting values and optimisation paths, AutoSynth was run 500 times. Rather than selecting one potentially arbitrary result, the researchers reported the median score across those runs. The broad geographical pattern was strikingly stable. The historic centre and western parts of Florence emerged as the most vulnerable areas, while eastern suburbs and southern districts tended to appear less vulnerable. The result challenges the assumption that internationally famous or visually attractive places are automatically socially secure. In the historic centre, the authors connect vulnerability to gentrification, the presence of older and less expensive housing, the concentration of students and immigrants, and the conversion of residential properties into short-term rentals.
Western Florence displayed a different pattern. Whereas the historic centre combined severe disadvantage with substantial internal inequality, western areas were described as more uniformly affected by low income and long-standing socioeconomic difficulties. AutoSynth, PCA, and AMPI produced different numerical scales, but their rankings of neighbourhoods were broadly similar. This convergence matters because composite indices are often used to decide where resources should be directed. If different construction methods identify the same areas, confidence in the broad pattern increases. The machine-learning method’s claimed advantage appeared elsewhere: in its ability to reproduce the distances between neighbourhoods in the original multidimensional indicator space. The researchers used a stress statistic, adapted from multidimensional scaling, that compares pairwise distances before and after compression. A lower stress value means that the one-dimensional index more faithfully reflects how different the original areas were across all indicators.
To test AutoSynth beyond Florence, the researchers applied it to 3,136 U.S. counties using a 2019 dataset associated with the CDC and the Agency for Toxic Substances and Disease Registry. This Community Vulnerability Index combined 14 indicators organised around economic, social, health, and cultural conditions. The variables included median earnings, inequality, unemployment, poverty, school enrolment, graduate education, early school leaving, obesity, lack of health insurance, ethnic composition, and child and elderly poverty. The resulting map revealed familiar but important geographic contrasts. Counties in and around New York, Washington, Philadelphia, New England, and Boston generally showed lower vulnerability, while a broad southern belt stretching from the Carolinas toward Texas contained many of the highest-scoring areas, especially in Mississippi and Louisiana. The authors also observed clusters that crossed state boundaries, suggesting that vulnerability may form regional systems rather than isolated local pockets.
In this larger application, the differences in stress were more pronounced. AutoSynth produced a median stress value of approximately 0.45, compared with 0.72 for PCA and 0.83 for AMPI. In practical terms, the one-dimensional AutoSynth score preserved the relative separations among counties more effectively than the competing indices. A county that differed substantially from another across the original 14 indicators was more likely to remain distant in the AutoSynth representation. The researchers interpret this as evidence that nonlinear compression can retain information that is lost when data are reduced through linear or formula-based aggregation. They also found that the percentage of uninsured residents was the most salient indicator according to their post-estimation relevance measure, which was based on each variable’s average reconstruction error. Indicators that were reconstructed less accurately were treated as more influential in shaping the latent representation, although this interpretation requires care because reconstruction error can also reflect noise, unusual distributions, or poor model fit.
A simulation study explored when the method works best. The researchers generated datasets containing 14 indicators under three conditions: independent normally distributed variables; correlated variables sharing the same distribution; and correlated variables drawn from heterogeneous distributions, including uniform, chi-square, Poisson, exponential, Student’s t, and normal distributions. They examined samples of 50, 250, and 1,000 observations, repeating each scenario 1,000 times. Across the simulations, AutoSynth generally achieved lower stress than the arithmetic mean, AMPI, and PCA, particularly as sample size increased and the indicators became non-identically distributed. The result supports the intuition that a flexible nonlinear model becomes more valuable when the data contain complicated dependencies and mixed statistical behaviour. At the same time, the authors acknowledge that small samples create instability. Because different random initialisations can produce different latent scores, repeated estimation and summary statistics are essential. When AutoSynth offers only a marginal improvement over simpler methods, its additional complexity may not be justified.
The study’s broader contribution is therefore not that neural networks automatically produce a definitive measure of social disadvantage. Rather, it offers a new tool for a problem in which every aggregation method embeds assumptions. AutoSynth can create a single index, but it can also be organised hierarchically: indicators from the same domain could first be compressed into economic, demographic, or social sub-indices, which could then be combined into an overall score. The method can also estimate how strongly individual indicators affect reconstruction and can incorporate prior expert weights. Yet the approach has clear limitations. A one-dimensional code inevitably discards information, and the polarity of the result—whether high values mean greater vulnerability or better conditions—cannot be known in advance. The researchers used AMPI as a reference to orient the score, reversing AutoSynth’s direction when necessary. Neural-network architecture, activation functions, training parameters, distance metrics, and weighting choices can all alter the outcome. Most importantly, an index learned from available data cannot compensate for indicators that are missing, poorly measured, or conceptually irrelevant. AutoSynth may make complex information easier to see, but the meaning of that information still depends on theory, data quality, and careful validation. (Source: Grossi, G., & Rocco, E., Social Indicators Research, 2026.)
Cite Scienmag News
Courtney Benton. (August 26, 2026). Autoencoders Create a Synthetic Socioeconomic Index for Florence’s Suburban Areas. Scienmag. https://scienmag.com/autoencoders-create-a-synthetic-socioeconomic-index-for-florences-suburban-areas/
Courtney Benton. "Autoencoders Create a Synthetic Socioeconomic Index for Florence’s Suburban Areas." Scienmag, 26 August 2026, https://scienmag.com/autoencoders-create-a-synthetic-socioeconomic-index-for-florences-suburban-areas/. Accessed 3 September 2026.
Courtney Benton. "Autoencoders Create a Synthetic Socioeconomic Index for Florence’s Suburban Areas." Scienmag. August 26, 2026. https://scienmag.com/autoencoders-create-a-synthetic-socioeconomic-index-for-florences-suburban-areas/


