


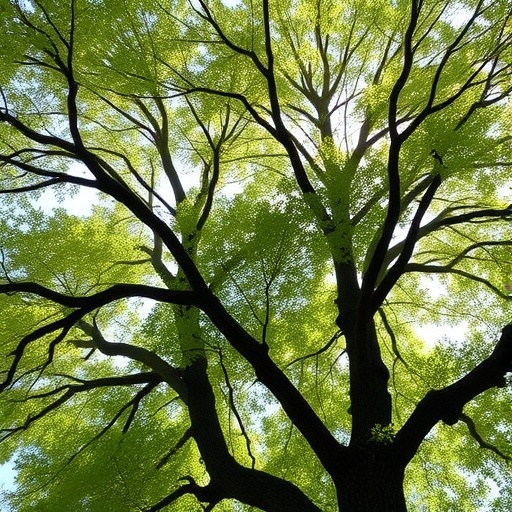
Cities may soon be able to identify their hottest walking routes with the same precision used to map traffic or public transport. HeiGIT, the Heidelberg Institute for Geoinformation Technology, has added a tree-shade indicator to its free Climate Action Navigator, a digital platform designed to help municipalities and civil society organizations understand how urban environments affect everyday life. The new tool provides a street-level view of where pedestrian paths are protected by tree canopies and where people are exposed to direct sunlight, offering planners a detailed basis for decisions about urban greening, heat adaptation and safer walking routes.
The need for such information is becoming increasingly urgent as cities experience more frequent and intense heat waves. A citywide estimate of tree cover can suggest that an urban area is relatively green while concealing major differences between neighborhoods. In one district, a large park or wooded hillside may raise the average, even though the streets used daily by residents remain almost entirely unshaded. The Climate Action Navigator is designed to reveal these local contrasts by measuring shade along pedestrian routes rather than relying only on broad land-cover statistics.
In Innsbruck, Austria, tree cover extends across approximately 30 percent of the city’s relevant areas, but the distribution is far from even. Much of the shaded pedestrian network lies outside the central urban area, while heavily used streets in the city center can remain exposed to full sun. This distinction matters because people experience heat at the scale of individual journeys: walking to school, commuting to work, visiting shops or reaching public transport. Two routes separated by only a few streets may therefore offer very different levels of thermal comfort and protection from solar radiation.
The indicator is also intended to connect physical infrastructure with human behavior and well-being. Shaded paths can make walking more attractive during hot weather, potentially influencing whether people choose to travel on foot, wait for public transport or avoid certain destinations altogether. Claudia Schmiedeberg of the GLEN Study said that understanding the social effects of climate change requires examining how local surroundings shape daily decisions over time. Combining the tree-shade data with longitudinal survey information could help researchers investigate whether residents in greener neighborhoods adapt differently to heat, and whether unequal access to shade contributes to wider social disparities.
Technically, the tool identifies pedestrian walkways that directly overlap with tree canopies at least two meters high. The height threshold is designed to distinguish trees capable of producing meaningful overhead shade from low shrubs, grass and ground vegetation. The analysis uses high-resolution global canopy datasets and applies the same processing method across different cities. This allows a small town, a regional center and a major capital to be compared using a consistent measure rather than relying on incompatible local mapping systems.
The calculation also models a high-noon scenario, when the sun is strongest and shadows are generally shortest. By estimating shade under these demanding conditions, the indicator focuses on a daily period when heat exposure may be especially severe. It measures the availability of shade at what the developers describe as the weakest point of the day, creating a conservative benchmark for planning. The result is not a complete simulation of human thermal comfort, which also depends on air temperature, humidity, wind, pavement materials and building geometry, but it provides a clear spatial signal of where tree canopy is present above pedestrian infrastructure.
Early comparisons show how sharply shade levels can differ between cities. In the historic city of Maribor, Slovenia, approximately 35 percent of the pedestrian network is covered by trees. In Tempe, Arizona, a university city located in a hot and generally arid region, the corresponding figure is just above 7 percent. Such numbers do not by themselves determine whether a city is comfortable or unsafe, but they provide a comparable starting point for identifying exposure. When combined with information about schools, care facilities, public transport stops or tourist destinations, the data can show which groups and routes may require priority attention.
Urban planners could use the indicator to decide where new trees would provide the greatest benefit, while also recognizing streets where existing canopy already supports walking during hot periods. Linking shade maps with school catchment areas, for example, could reveal whether children have protected routes to school or must travel through long stretches of direct sunlight. Tourism agencies and local authorities could also use the information to recommend cooler walking routes to major attractions. In this way, the platform is intended not only to document an environmental problem but also to support targeted interventions, from tree planting and maintenance to short-term route guidance.
Jim Walker of the Walk21 Foundation said the indicator offers comparable, street-by-street evidence that can help administrations prioritize infrastructure investment during the hottest months. Its developers argue that global canopy datasets make it possible to overcome the local data shortages that often prevent smaller municipalities from conducting detailed climate assessments. Dr. Kirsten von Elverfeldt, community engagement manager at HeiGIT, said the goal was to make granular diagnostic information freely available so that greening initiatives can be directed toward the places where they are most needed.
The Climate Action Navigator is open to the public, allowing users to explore how their municipality performs and compare different urban areas. The platform’s tree-shade indicator does not replace on-the-ground assessments, but it can help transform an abstract climate challenge into a visible pattern of shaded and exposed streets. As heat increasingly shapes how people move through cities, that ability to see the difference at walking level could make urban climate planning more precise, more equitable and more immediately actionable.
News Publication Date: August 11, 2026
Web References: Climate Action Navigator: https://heigit.org/ ; Tree shade indicator video: https://www.youtube.com/watch?v=vAQxEnAgM44 ; Innsbruck example: plugin/hiwalk?share-id=f50386c3-4ea6-45b8-946a-6fedfae38dc8 ; Maribor example: plugin/hiwalk?share-id=f675a5bd-f15f-429c-81f4-80cac6c7051a ; Tempe example: plugin/hiwalk?share-id=31880ebb-1c6d-40e1-89cf-ffac9bceb607
Cite Scienmag News
Russell Cooper. (August 11, 2026). Tree Shade Reveals Directional Clues. Scienmag. https://scienmag.com/tree-shade-reveals-directional-clues/
Russell Cooper. "Tree Shade Reveals Directional Clues." Scienmag, 11 August 2026, https://scienmag.com/tree-shade-reveals-directional-clues/. Accessed 3 September 2026.
Russell Cooper. "Tree Shade Reveals Directional Clues." Scienmag. August 11, 2026. https://scienmag.com/tree-shade-reveals-directional-clues/


