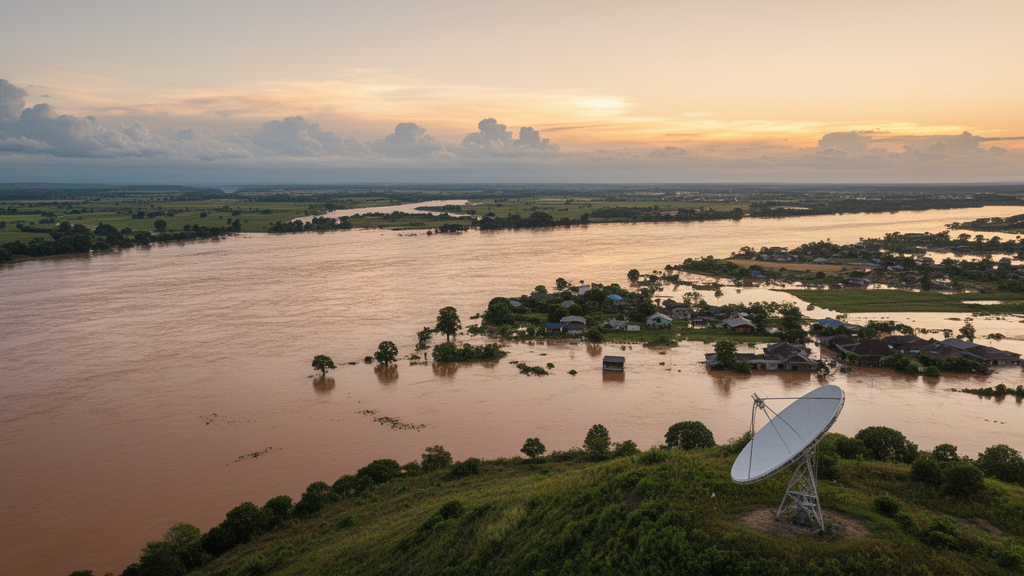
When the heaviest rainstorm on record struck Henan Province in July 2021, floodwaters submerged nearly 79 percent of the building area of Weihui City, inundated more than 14,000 houses, and damaged roughly 330 square kilometers of crops. Mapping the full extent of such a disaster quickly is one of the hardest problems in remote sensing, because the optical satellites that produce familiar color imagery are blinded by the very clouds that accompany catastrophic rain. A new study published in Natural Hazards and Earth System Sciences proposes a way around that obstacle, using the cloud-piercing radar of the European Sentinel-1 satellites and a simple statistical idea, the Z-score, to flag flooded ground automatically across large regions, including cities where radar flood mapping has long been unreliable.
The research team, led by Runmei Xing of Zhengzhou University together with Fengyuan Lu and Jun Zhao, built their method on a careful analysis of how radar backscatter behaves over time across different land surfaces. Synthetic aperture radar measures the strength of the microwave signal bounced back to the satellite. Smooth open water acts like a mirror, sending energy away from the sensor and producing very dark pixels, which is why floods are usually easy to spot in natural landscapes. Cities are far messier. Buildings generate complicated single, double, and multiple scattering paths, and the signal depends on satellite orbit direction, polarization, and the orientation of walls relative to the radar beam.
The key insight of the study concerns how flooding changes these signals in opposite directions depending on the environment. In natural areas, the consistency of backscatter intensity over a year of observations is strongly influenced by vegetation growth. Croplands, for example, show distinct seasonal swings tied to crop stages: during the vegetative phase, rising stems and denser leaves sharply boost volume scattering, especially in the cross-polarized VH channel, while the transition from vegetative stage to flood period leaves intensity relatively stable, making flood and normal growth hard to separate. In built-up areas, the picture reverses. When floodwater surrounds buildings, it creates a reflective plane that bounces radar energy onto walls, intensifying the so-called double-bounce effect and making flooded neighborhoods brighter in radar images. The authors found that once flooding began, both VV and VH backscatter in urban areas jumped by more than 6 decibels, while in the absence of flooding the urban signal stayed remarkably stable through the seasons.
That stability is what makes a statistical anomaly detector possible. The researchers compiled a year-long time series of Sentinel-1 images from the same orbital path, covering January through December 2021, and processed each acquisition with standard corrections: precise orbit refinement, thermal noise removal, radiometric calibration, speckle filtering, and terrain correction. For every pixel, they computed the mean and standard deviation of backscatter during a non-flood reference period, then expressed each flood-period observation as a Z-score, the number of standard deviations it sits from the baseline mean. A Z-score below a negative threshold signals the sharp darkening typical of open-water flooding; above a positive threshold, it signals the brightening typical of urban inundation.
Before trusting those numbers, the team tested the statistical assumption underneath them. The Z-score interpretation is cleanest when data follow a normal distribution, so they calculated skewness and excess kurtosis for representative land-cover classes during the reference period. The distributions were not perfectly Gaussian: median skewness for individual VV and VH channels ranged from 0.734 to 1.740, and excess kurtosis from 0.048 to 2.596, with all classes right-skewed. Deviations were smallest for urban VH backscatter and largest for cropland, likely reflecting crop phenology and rainfall-driven moisture changes. The VV-to-VH ratio departed even further from normality, so the authors restricted their confidence-level interpretation to the independently standardized VV and VH channels. They are explicit about the consequence: Z-score thresholds should be read as standardized anomaly levels with statistical meaning under approximate normality, not as exact pixel-level flood probabilities in every land-cover type.
The classification itself is a decision tree that combines both polarizations with auxiliary data. Pixels identified as seasonal or permanent water in the Joint Research Centre’s Global Surface Water dataset, using an occurrence threshold of 25 percent, are excluded so that only newly emerged water is counted. In natural areas, pixels whose VV and VH Z-scores both fall below the threshold receive a dual-polarization flood label, and those with only one channel below it receive a single-polarization label; the same logic, with a separate threshold, applies in building areas using positive anomalies. Dual-polarization matters because heavy rain and wind roughen water surfaces, strengthening VV backscatter through Bragg scattering and hiding open water, while VH remains less affected. A final post-processing step removes isolated patches of four or fewer connected pixels to suppress speckle noise, though the authors note this rule can also erase genuine small puddles and narrow drainage features.
Applied to the Weihui flood, the method performed strongly. Validated against Sentinel-2 optical imagery in natural areas, where the time gap between radar and optical acquisitions was 8 to 9 hours, the approach reached a critical success index of 60 percent and an overall accuracy of 90 percent. In building areas, validated against high-resolution drone imagery acquired only about 2 hours after the radar pass, it achieved a critical success index of 62 percent and overall accuracy of 73 percent. The critical success index, which balances errors of omission and commission, is considered the most informative single metric for flood mapping because flooded pixels are usually a small minority of the scene. The team also quantified the uncertainty introduced by the optical-to-radar time lag by excluding pixels that changed between two bracketing Sentinel-2 water masks.
Comparisons against four baseline methods showed where the approach earns its keep. In natural areas, conventional Otsu thresholding actually scored slightly higher, with a critical success index of 63 percent and overall accuracy of 92 percent, because open floodplains offer clean separation between water and land in a histogram. But in building areas the ranking flipped dramatically: Otsu fell to 39 percent and 50 percent, simple image differencing to 45 percent and 56 percent, and single-polarization Z-score detection to the low fifties and mid-sixties, while the proposed dual-polarization tree reached 62 percent and 73 percent. Averaged across both environment types, the new method delivered a mean critical success index of 61 percent and overall accuracy of 81.5 percent, the best worst-case performance of any method tested. The authors also compared their results with the Copernicus Sentinel-1 Global Flood Monitoring product, an operational near-real-time service, and found it ineffective for urban flood mapping in Weihui and slightly less accurate in natural areas.
The study is candid about its limits. The most striking failure mode emerged in low-lying neighborhoods of single-story and low-rise houses where floodwater nearly reached the rooftops. There, the height difference between buildings and water collapses, wall-water double-bounce scattering weakens or vanishes, and rooftop scattering dominates, so even severely inundated areas can be missed. The 30-meter Copernicus DEM used in the study cannot resolve individual buildings or streets, so the extent of this failure mechanism could not be quantified; the authors propose high-resolution digital surface models, building footprints, and building-height data as the remedy. Under-canopy flooding beneath forests also went untested for lack of validation data, and the researchers suggest that L-band radar from satellites such as LuTan-1 may penetrate vegetation better in future work.
What the method offers, within those limits, is operational practicality. It requires only freely available Sentinel-1 ground range detected time series, a global surface water layer, and simple statistics, with thresholds tied to explicit confidence levels rather than tuned per event. Because baseline statistics are computed independently for each sensor configuration, the framework can absorb multi-source radar data to raise observation frequency during an emergency. For a world in which satellite-based studies indicate the flood-affected share of the global population grew by more than 20 percent between 2000 and 2015, a tool that maps both vast rural inundation and street-level urban flooding from a single, transparent statistical rule is a meaningful addition to the disaster-response toolkit.
Subject of Research: A time-series Sentinel-1 SAR and Z-score anomaly-detection method for large-scale flood and urban inundation monitoring
Article Title: Large-scale flood monitoring based on time-series Sentinel-1 images and Z-score
Article References: Xing, R., Lu, F., & Zhao, J. (2026). Large-scale flood monitoring based on time-series Sentinel-1 images and Z -score. Natural Hazards and Earth System Sciences, 26(10), 5299-5314. https://doi.org/10.5194/nhess-26-5299-2026
Image Credits: AI Generated
DOI: 10.5194/nhess-26-5299-2026
Keywords: flood monitoring, Sentinel-1, SAR, Z-score, urban inundation, remote sensing, Weihui, Henan flood 2021, double-bounce scattering, dual-polarization, Copernicus, disaster response
Cite Scienmag News
Violet Maxwell. (October 28, 2026). Z-Score Method Turns Sentinel-1 Radar Time Series into Large-Scale Flood Maps. Scienmag. https://scienmag.com/z-score-method-turns-sentinel-1-radar-time-series-into-large-scale-flood-maps/
Violet Maxwell. "Z-Score Method Turns Sentinel-1 Radar Time Series into Large-Scale Flood Maps." Scienmag, 28 October 2026, https://scienmag.com/z-score-method-turns-sentinel-1-radar-time-series-into-large-scale-flood-maps/. Accessed 29 October 2026.
Violet Maxwell. "Z-Score Method Turns Sentinel-1 Radar Time Series into Large-Scale Flood Maps." Scienmag. October 28, 2026. https://scienmag.com/z-score-method-turns-sentinel-1-radar-time-series-into-large-scale-flood-maps/