


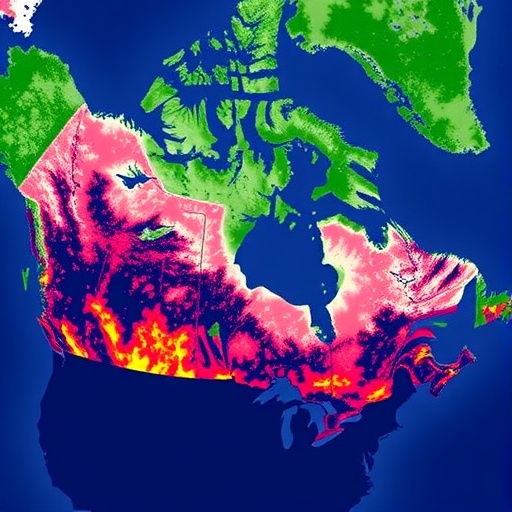
The narrow band where Canada’s boreal forest gives way to Arctic tundra is one of the most consequential ecological boundaries on Earth, and it is quietly moving. As climate warming accelerates across the high latitudes, trees are creeping northward, shrubs are thickening, and the productivity of entire landscapes is being rewritten. Yet tracking how much carbon these vast, roadless ecosystems actually absorb has long been a major stumbling block for scientists. A new study published in Environmental Monitoring and Assessment offers a way forward, presenting detailed 30-meter-resolution maps of gross primary productivity (GPP) across the Canadian boreal-tundra transition zone and revealing, in unprecedented detail, how productivity shifts with every kilometer of treeline position.
The research, led by R. Melser of the University of British Columbia’s Department of Forest Resources Management, together with N. C. Coops, H. Travers-Smith, M. A. Wulder, C. Derksen, and S. H. Knox, applied a remote sensing model known as CAN-TG to estimate photosynthetic carbon uptake along treeline transects spanning the Canadian North. The work was funded by the Canadian Space Agency under grant 23SUESCARB and drew on an unusually rich combination of satellite data streams, each capturing a different facet of how these ecosystems function.
Gross primary productivity is the total amount of carbon that vegetation fixes through photosynthesis, and it sits at the heart of the terrestrial carbon cycle. In northern ecosystems, GPP is tightly coupled to ecosystem respiration, meaning that even modest changes in plant carbon uptake can determine whether a landscape functions as a net carbon sink or source. That sensitivity makes accurate GPP estimates essential for projecting the future of high-latitude carbon storage. The problem, however, has always been scale. Flux towers, the gold standard for measuring carbon exchange, are scarce across the Arctic and subarctic, and the eddy covariance sites that do exist are spatially sparse and often unrepresentative of the surrounding mosaic of tundra, wetlands, lakes, and stunted forest. Coarse-resolution satellite products, typically operating at pixels of several hundred meters to a kilometer, blur that fine-grained patchiness into uninformative averages.
The CAN-TG model was designed specifically to close that gap. It combines satellite observations of vegetation greenness, land surface temperature, soil moisture, and freeze/thaw state, variables that together encode the key physiological, hydrological, and phenological constraints on boreal productivity. The greenness signal, derived from Harmonized Landsat Sentinel-2 surface reflectance data at 30-meter resolution, captures the amount and condition of photosynthesizing vegetation. Land surface temperature from the Copernicus Sentinel-3 SLSTR instrument constrains the thermal environment in which photosynthesis operates, a critical factor where growing seasons are short and cold nights can throttle carbon uptake. SMAP-derived soil moisture reflects the water limitations and wetland dynamics of the boreal-tundra ecotone, while SMAP freeze/thaw state marks the onset and end of the biologically active season, because plants in these regions cannot photosynthesize once soils refreeze.
Blending these sources is not trivial, since they arrive at different spatial resolutions, from 9-kilometer SMAP products down to 30-meter optical imagery. The study team harmonized these inputs and ran the CAN-TG model to produce annual GPP estimates at the fine 30-meter scale across the entire Canadian transition zone, something that previous coarse-resolution modelling efforts simply could not achieve in landscapes where a single kilometer-scale pixel might encompass forest stands, shrub tundra, wetlands, and open water all at once.
Validation was a central concern. Because in situ flux measurements are so rare along the treeline, the researchers evaluated their model outputs against two independent satellite-derived references: GPP estimates from the FLUXCOM-X data-driven framework and solar-induced fluorescence, or SIF, a signal emitted by actively photosynthesizing chlorophyll that has become one of the most trusted proxies for vegetation carbon uptake. The agreement was strong. At coarse spatial scales, the CAN-TG estimates showed correlations of approximately 0.91 with FLUXCOM-X GPP and 0.88 with SIF, figures that lend considerable credibility to the fine-scale product. When aggregated, the fine-resolution estimates reproduce the patterns that coarser models capture, but with far more spatial detail retained beneath the aggregate.
The most striking findings emerged when the researchers analyzed GPP along transects running perpendicular to the treeline. As expected, productivity declines as one moves from closed boreal forest into open tundra, but the new maps quantify this gradient with remarkable precision. The study found that annual GPP shifts by 0.12 to 0.36 grams of carbon per square meter per year for every 1-kilometer change in treeline position. This relationship held consistently across the study domain, demonstrating that treeline position, which can now be mapped at fine resolution using ICESat-2 laser altimetry combined with Landsat time series, is a reliable predictor of landscape-scale carbon uptake.
The implications compound over time and space. If the treeline advances northward in response to warming, as field observations and modeling studies suggest it will in many regions, the resulting increase in forested area could raise annual GPP across the study domain by 0.77 to 2.32 teragrams of carbon per year over the next century. A teragram is one billion kilograms, so even the lower bound represents a substantial quantity of additional photosynthetic carbon fixation. The researchers caution, however, that these increases in GPP do not translate directly into carbon storage. Because GPP and respiration are so tightly coupled in northern ecosystems, much of the additional carbon fixed by expanding forests is likely to be balanced by increased release from soils and vegetation. Recent work across the boreal zone has shown that gains in gross primary production are often matched by gains in ecosystem respiration, and disturbances such as wildfire and permafrost thaw can tip the balance toward carbon loss despite rising productivity.
That nuance is precisely why fine-scale monitoring matters. The fate of the northern carbon sink depends on where trees establish, how forest structure changes locally, which areas burn or thaw, and how hydrological conditions shift across the patchy transition zone. A model running at kilometer resolution cannot distinguish a densifying forest stand from an expanding wetland; a 30-meter model can. The framework presented in this study provides a scalable way to monitor those local dynamics consistently across enormous and inaccessible territories, using freely available satellite data products from the Copernicus programme, NASA, the Canadian Forest Service, and Statistics Canada.
The researchers emphasize that the approach is not static. As the Harmonized Landsat Sentinel-2 record lengthens, as SMAP continues to deliver soil moisture and freeze/thaw observations, and as new treeline maps are updated, the same pipeline can be rerun to track year-to-year changes in productivity along the entire Canadian treeline. That capacity becomes increasingly valuable as the pace of ecological change at high latitudes quickens, with documented shrubification, altered fire regimes, and permafrost degradation reshaping the boreal-tundra boundary. The study also offers a template that could be adapted to other treeline regions of the circumpolar North, from Alaska to Scandinavia to Siberia, wherever coarse-resolution products have obscured the fine structure of one of the planet’s most rapidly changing biomes.
In an era when the Arctic is warming several times faster than the global average, knowing exactly where, and by how much, the northern biosphere is changing its carbon metabolism is no longer a luxury. With this new fine-resolution framework, the invisible carbon accounting of the treeline is coming into sharp focus.
Cite Scienmag News
Violet Maxwell. (September 9, 2026). Tracking treeline productivity across Canada with multi-source remote sensing. Scienmag. https://scienmag.com/tracking-treeline-productivity-across-canada-with-multi-source-remote-sensing/
Violet Maxwell. "Tracking treeline productivity across Canada with multi-source remote sensing." Scienmag, 9 September 2026, https://scienmag.com/tracking-treeline-productivity-across-canada-with-multi-source-remote-sensing/. Accessed 9 September 2026.
Violet Maxwell. "Tracking treeline productivity across Canada with multi-source remote sensing." Scienmag. September 9, 2026. https://scienmag.com/tracking-treeline-productivity-across-canada-with-multi-source-remote-sensing/


