


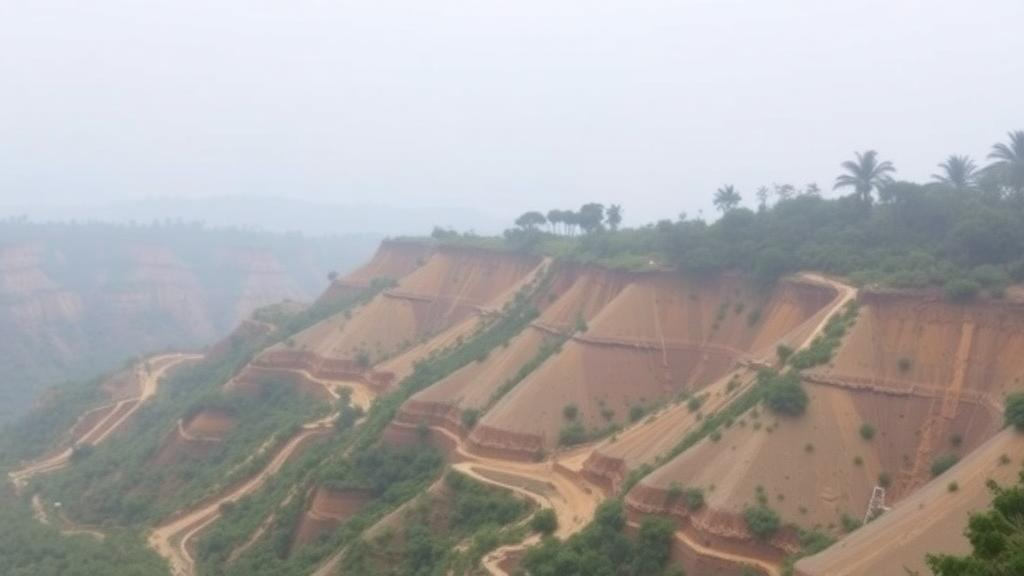
Deep in the hilly terrain of Nagaland, where the Dikhow River carves its way northward through some of the most landslide-prone landscape in India, a team of researchers has produced the first comprehensive map of where the ground is most likely to give way. The study, published in Discover Geoscience, compared two widely used statistical techniques for landslide susceptibility mapping and found that the simpler of the two delivered the more reliable picture of danger. In a region where a single June 2023 landslide severed a vital road connecting two major towns, the work offers something the region has never had before: a data-driven blueprint of where the next slope failure is most likely to strike.
The research team, led by Anannya Panging of Mizoram University together with colleagues from institutions across India, focused on the Dikhow River Basin, a drainage system covering roughly 3,971 square kilometres. The river rises near Zunheboto peak in Nagaland and flows north through Assam before joining the Brahmaputra, its basin spanning steep mountainous country in the south and flat alluvial plains in the north. Geologically, the upper basin is built from the Disang, Barail and Tipam groups of Eocene to Miocene age, dominated by sandstones, shales and clays, materials that are notoriously fragile when saturated by the region’s intense monsoonal rainfall. Nagaland falls within Zone V, the highest category, of India’s landslide hazard zonation map, yet no previous study had ever assessed landslide susceptibility across this basin.
To build their maps, the researchers compiled an inventory of 632 landslides identified from Google Earth imagery, then split the records into a training set of 442 points and a testing set of 190 points in a 70:30 ratio. They paired this inventory with twelve landslide conditioning factors: slope, aspect, elevation, rainfall, lithology, lineament density, distance to streams, the Normalized Difference Vegetation Index, the Topographic Wetness Index, land use and land cover, the Stream Power Index, and curvature. Each factor was derived from publicly available data, including the Shuttle Radar Topography Mission digital elevation model, Geological Survey of India lithological records, gridded rainfall data from 2003 to 2021, and 10-metre land cover imagery. All layers were resampled to a common 30-metre resolution and projected into a single coordinate system before analysis.
The two competing techniques were the Frequency Ratio model and the Index of Entropy model, both bivariate statistical approaches that quantify the association between past landslide locations and each class of each conditioning factor. The Frequency Ratio method is elegantly simple: for every class of every factor, it calculates the ratio of the proportion of landslide pixels to the proportion of the total area. A value above one signals a positive correlation with landsliding, below one a negative one. The Index of Entropy, by contrast, borrows Shannon’s information theory to assign weights that account for the uncertainty, or disorder, in the distribution of landslides across factor classes, producing a more elaborate weighting scheme. Both models are prized for their transparency and their ability to reveal threshold values, an advantage over black-box machine learning approaches when the goal is to explain why certain slopes fail.
Before running the models, the team checked for multicollinearity among the twelve factors using the Variance Inflation Factor and Tolerance statistics. Values ranged from 1.059 to 2.024 for VIF and 0.494 to 0.944 for Tolerance, well within acceptable limits, confirming that no factor was redundant and all twelve could legitimately enter the analysis. The relative importance of the factors then diverged between the models in an instructive way. In the Frequency Ratio framework, land use and land cover emerged as the single most influential factor, followed by slope, lithology and the Topographic Wetness Index. The Index of Entropy instead gave top weighting to the Topographic Wetness Index, with slope and land cover nearly tied at around 0.34. The discrepancy reflects the different mathematical machinery behind the two methods and hints that landslides here are not driven by any single cause but by interacting combinations of terrain, geology, hydrology and human activity.
The spatial patterns the models uncovered are striking. Landslides clustered in intermediate elevations between roughly 329 and 1,589 metres, on steep slopes where frequency ratios climbed as high as 3.19 in the steepest class of 35 to 71 degrees. Concave slopes, which accumulate water and raise pore pressure, showed a frequency ratio of 1.71, while carbonaceous sandy shale proved the most dangerous lithology with a ratio of 2.13, its moderate permeability and the chemical weathering of carbonate making it especially unstable. Counterintuitively, some of the lowest rainfall zones showed the strongest landslide associations, likely because those areas combine high lineament density, low vegetation cover and steep terrain, while the wettest zones sit largely on the stable plains of Assam. Built-up areas and rangeland, where human slope modification strips away protective vegetation, both showed positive associations with landsliding, underscoring the growing role of anthropogenic pressure on the region’s slopes.
When the two susceptibility maps were assembled and classified into five zones from very low to very high using natural-break classification, the differences between the models became vivid. The Frequency Ratio model flagged 19.9 percent of the basin as very highly susceptible and another 34.1 percent as highly susceptible, whereas the Index of Entropy assigned only 8.4 percent to the very high class and 22.7 percent to the high class. In both maps, the danger zones concentrated in the southern, south-eastern and south-western portions of the basin, particularly the steep uplands of Nagaland, with the districts of Tuensang, Mon and Longleng bearing the brunt. The northern, downstream plains registered low to very low susceptibility in both models, a reassuring result for the densely settled valley areas near the Brahmaputra confluence.
Validation separated the two contenders decisively. Using the area under the receiver operating characteristic curve, the gold-standard measure of predictive skill, the Frequency Ratio model scored 0.81 on the training data and 0.82 on the testing data, both firmly in the very good range. The Index of Entropy achieved 0.79 and 0.80 respectively, respectable but consistently a step behind. A second validation metric, the relative landslide density or R-index, told the same story: 64.81 percent of recorded landslides fell within the very high susceptibility zone of the Frequency Ratio map, compared with 60.25 percent for the entropy map, and landslide density rose steadily from low to high classes in both, confirming that the maps captured real spatial structure rather than statistical noise. The researchers attribute the entropy model’s slight underperformance to the narrow range of its factor weights in a basin where landslides respond to complex, interacting conditions rather than any single dominant trigger.
The practical implications extend well beyond academic comparison. The very high and high susceptibility zones identified by the Frequency Ratio map cover the upper Dikhow basin, precisely where road connectivity has repeatedly been severed and where landslides have claimed lives and destroyed property. The authors position the maps as a preliminary screening tool for hazard management and early warning systems, one that government agencies, policymakers and land-use planners can use to prioritise slope stabilisation, regulate construction on fragile hillsides and route infrastructure away from the most dangerous terrain. The method itself, built entirely from freely available satellite and government data, is transferable to other data-scarce mountainous regions facing similar monsoon-driven slope failures.
The study is candid about its limits. Seismic factors were excluded because ground data were unavailable, despite the region’s tectonic activity along features such as the Naga Thrust, and the temporal and spatial resolution of remote sensing data constrains the precision of any inventory-based mapping. The authors call for site-specific geotechnical investigation as the next step and point toward physics-informed machine learning and transfer learning techniques, which can carry knowledge from data-rich regions into data-poor ones, as the future of susceptibility modelling in the Northeast. For now, though, the message from the Dikhow basin is clear: sometimes the simplest statistical tool, applied carefully to good data, beats its more sophisticated rivals, and in doing so can hand a vulnerable region its first real map of where the earth is most likely to move.
Subject of Research: Comparative GIS-based landslide susceptibility mapping of the Dikhow River Basin using frequency ratio and index of entropy statistical models
Article Title: Comparative evaluation of frequency ratio and index of entropy models for landslides susceptibility mapping of Dikhow river basin, Northeast India
Article References: Panging, A., Rao, K. S., Simhachalam, A., Barman, J., Kawilam, L., & Barman, B. K. (2026). Comparative evaluation of frequency ratio and index of entropy models for landslides susceptibility mapping of Dikhow river basin, Northeast India. Discover Geoscience, 4(1), Article 389. https://doi.org/10.1007/s44288-026-00737-6
Image Credits: AI Generated
DOI: 10.1007/s44288-026-00737-6
Keywords: landslide susceptibility mapping, frequency ratio, index of entropy, Dikhow River Basin, Nagaland, Northeast India, GIS, bivariate statistical models, natural hazards, monsoon rainfall, slope instability, ROC-AUC validation
Cite Scienmag News
Violet Maxwell. (October 2, 2026). Simple Statistical Models Outperform in Mapping Landslide Danger in Northeast India. Scienmag. https://scienmag.com/simple-statistical-models-outperform-in-mapping-landslide-danger-in-northeast-india/
Violet Maxwell. "Simple Statistical Models Outperform in Mapping Landslide Danger in Northeast India." Scienmag, 2 October 2026, https://scienmag.com/simple-statistical-models-outperform-in-mapping-landslide-danger-in-northeast-india/. Accessed 17 October 2026.
Violet Maxwell. "Simple Statistical Models Outperform in Mapping Landslide Danger in Northeast India." Scienmag. October 2, 2026. https://scienmag.com/simple-statistical-models-outperform-in-mapping-landslide-danger-in-northeast-india/


