


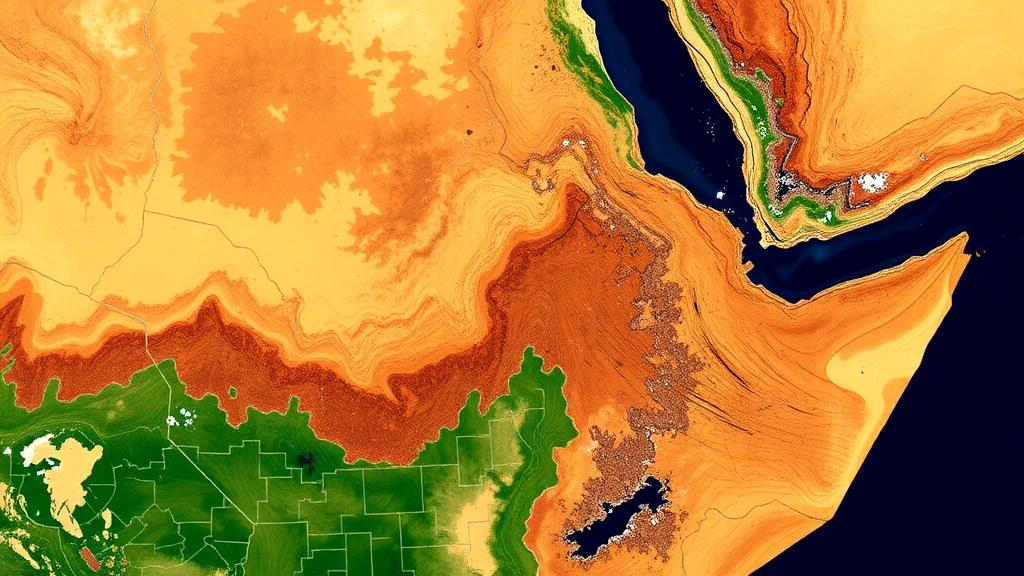
In the highlands and lowland fringes of northeast Ethiopia, where millions of smallholder families depend on rain-fed agriculture for nearly everything they eat and earn, drought is not an abstraction. It is the difference between a harvest that carries a household through the year and a season of hunger. Yet detecting agricultural drought early and accurately has long been one of the hardest problems in the region, because drought does not announce itself with a single measurement. Rainfall can look deceptively normal while soils dry out, vegetation browns, and heat stress quietly erodes yields. A new study published in Theoretical and Applied Climatology takes on that challenge in Guba Lafto and its surrounding areas, using a battery of satellite-derived indices to reconstruct, in remarkable detail, when and where drought struck between 2015 and 2022.
The research, carried out by Alehegn Kirub Beyene of the Department of Civil Engineering at Dilla University, draws on some of the most powerful Earth-observation data streams currently available to scientists. Rather than relying on any single indicator, the study combines vegetation measurements from two Moderate Resolution Imaging Spectroradiometer products, known as MOD13Q1 and MOD11A2, soil moisture estimates from NASA’s Soil Moisture Active Passive mission, and rainfall estimates from the Climate Hazards Group Infrared Precipitation with Stations dataset, widely known as CHIRPS. From these inputs, the author generated six complementary drought indices, each capturing a different facet of how water stress builds up in a farming landscape.
The logic behind using multiple indices is central to the study’s value. The Normalized Difference Vegetation Index, or NDVI, tracks the greenness and vigor of vegetation by measuring how strongly plants reflect near-infrared light compared with red light, offering a direct read on crop health. Land Surface Temperature, or LST, derived from thermal infrared measurements, reveals how hot the ground itself has become, which matters because overheated soils accelerate evaporation and stress plants. The Vegetation Condition Index and Temperature Condition Index then place these raw measurements in historical context, expressing current vegetation greenness and surface temperature as departures from long-term norms for the same time of year. When vegetation is unusually sparse or the land unusually hot for a given season, these indices flag it.
Two further indices deepen the picture. The Vegetation Health Index blends the vegetation and temperature condition indices into a single measure, exploiting the fact that healthy crops are typically both green and cool, while drought-stressed crops turn brown and hot. The Soil Moisture Condition Index, built from the SMAP satellite’s microwave measurements, captures the water actually held in the top layers of the soil, which is arguably the most direct signal of agricultural drought because plant roots draw from that reservoir. Finally, the Standardized Precipitation Index, computed from CHIRPS rainfall data, characterizes the meteorological side of drought, describing how unusually dry a period has been relative to the long-term climate. Together, these six lenses allow the researcher to distinguish between a dry spell that crops shrug off and one that genuinely devastates production.
The results paint a sobering portrait of a region living perpetually on the edge of water stress. Drought conditions, the study found, occurred to varying degrees throughout the entire study period, meaning there was no year in which the area fully escaped the specter of agricultural drought. But the severity was far from uniform. Severe to extreme drought conditions were observed in 2013 and 2014, and 2015 emerged as the most catastrophic year in the record, with drought affecting more than 65 percent of the study area. That finding aligns with the broader history of the mid-2010s in Ethiopia, when failed rains triggered one of the country’s worst food crises in decades and forced a massive humanitarian response.
What makes the study particularly useful for planners is its spatial resolution of drought’s footprint. By integrating the different drought indices into a composite agricultural drought severity map, the author was able to quantify how much of the landscape suffered and how badly over the common observation period from 2015 to 2022. The verdict: approximately 78 percent of the study area experienced mild drought conditions, while just under 22 percent, precisely 21.97 percent, endured moderate drought. Although the common period did not reproduce the extremes of 2015, the near-ubiquity of at least mild drought underscores how chronically water-stressed this farming region is, and how thin the margin between tolerable stress and genuine crisis has become.
The technical approach also highlights how much drought monitoring has changed in the satellite era. MODIS instruments aboard NASA’s Terra and Aqua satellites have been scanning the entire planet every one to two days since the early 2000s, providing the long, consistent records needed to establish what ‘normal’ vegetation and temperature look like at any point in the growing season. SMAP, launched in 2015, measures soil moisture globally by sensing the microwave emissions that the water in soil naturally radiates, a technique that works through clouds and requires no ground instrumentation. CHIRPS, developed by the Climate Hazards Group at the University of California, blends infrared satellite estimates of rainfall with station gauge data to produce gridded precipitation records even in regions with sparse weather networks, which describes much of the Horn of Africa. All three datasets are freely available, which is why the author acknowledges the USGS Earth Explorer, NASA’s LP DAAC archive, and the CHIRPS data portal in the study’s acknowledgements.
The choice of Guba Lafto and its surroundings is significant in itself. The area lies within the North Wollo Zone of Ethiopia’s Amhara Region, a landscape long recognized as one of the country’s most drought-vulnerable. Previous research cited in the study, including work on vegetation health across the Ethiopian highlands and assessments of food security in North Wollo, has documented the region’s recurring entanglement with crop failure and chronic food insecurity. Farming there is dominated by smallholder plots tilled with traditional implements, highly dependent on the timing and amount of seasonal rains, and with little access to irrigation as a buffer. In such a system, an index-based early warning that flags deteriorating vegetation and soil conditions weeks before harvest failure becomes visible on the ground could translate directly into timely seed distribution, livestock destocking support, or food assistance.
The study’s findings are framed explicitly as decision-support material. The author notes that the integrated drought severity maps provide valuable information for stakeholders and decision-makers tasked with developing drought mitigation and adaptation strategies in the region. In practical terms, maps showing where mild versus moderate drought concentrated over an eight-year window can help authorities prioritize where to invest in soil and water conservation structures, drought-tolerant crop varieties, small-scale irrigation, or index-based crop insurance. The multi-index approach also guards against the false alarms and missed events that plague single-indicator monitoring, since a rainfall deficit that never translates into vegetation stress, or a heat wave that damages crops despite adequate rain, will be caught by the appropriate index in the ensemble.
The study is candid about its limits and its future direction. The author recommends that further detailed research be conducted in the study area using higher-resolution satellite data and ground control points, an important caveat because coarse-resolution products can blur the patchwork of small fields, differing soil types, and varied topography that characterizes Ethiopian highland agriculture. Validation against on-the-ground observations of crop condition, soil samples, and reported yields would strengthen confidence in the satellite-derived severity maps. Even so, the work demonstrates a template that other drought-prone regions can replicate cheaply: combine free, global satellite datasets, compute a suite of complementary indices, and integrate them into severity maps that tell decision-makers not just that drought happened, but where, how widely, and how severely. For a region where the next failed rain is always a question of when rather than if, that kind of foresight is not a luxury. It is infrastructure, as vital as any road or reservoir, built not of concrete but of light measured from orbit.
Subject of Research: Agricultural drought assessment using multiple satellite-derived drought indices in Guba Lafto, northeast Ethiopia
Article Title: Multiple indices based agricultural drought assessment in Guba Lafto and its surrounding, northeast Ethiopia
Article References: Beyene, A. K. (2026). Multiple indices based agricultural drought assessment in Guba Lafto and its surrounding, northeast Ethiopia. Theoretical and Applied Climatology, 157(11), Article 697. https://doi.org/10.1007/s00704-026-06610-3
Image Credits: AI Generated
DOI: 10.1007/s00704-026-06610-3
Keywords: agricultural drought, remote sensing, MODIS, SMAP, CHIRPS, NDVI, Vegetation Health Index, soil moisture, Ethiopia, drought monitoring, North Wollo, climate variability
Cite Scienmag News
Violet Maxwell. (October 11, 2026). Satellites Reveal How Drought Gripped a Farming Heartland in Northeast Ethiopia. Scienmag. https://scienmag.com/satellites-reveal-how-drought-gripped-a-farming-heartland-in-northeast-ethiopia/
Violet Maxwell. "Satellites Reveal How Drought Gripped a Farming Heartland in Northeast Ethiopia." Scienmag, 11 October 2026, https://scienmag.com/satellites-reveal-how-drought-gripped-a-farming-heartland-in-northeast-ethiopia/. Accessed 11 October 2026.
Violet Maxwell. "Satellites Reveal How Drought Gripped a Farming Heartland in Northeast Ethiopia." Scienmag. October 11, 2026. https://scienmag.com/satellites-reveal-how-drought-gripped-a-farming-heartland-in-northeast-ethiopia/


