


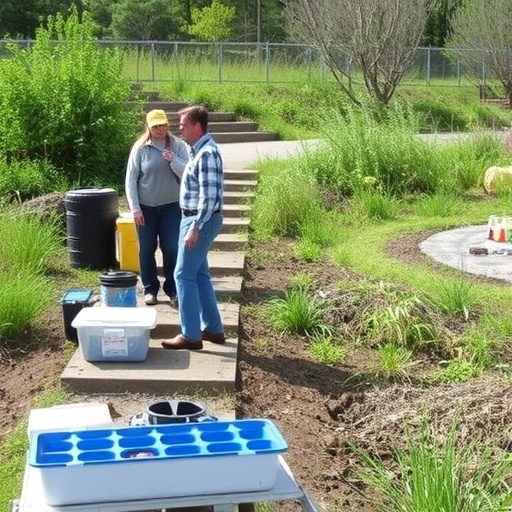
A new study published in the journal Environmental Management shows how a statistical tool borrowed from factory quality control floors could transform the way regulators, construction companies, and environmental inspectors verify that erosion and sediment controls are actually protecting streams and rivers during construction work. The research, led by Roland Cormier and Gabriel Goguen of Fisheries and Oceans Canada’s National Centre for Effectiveness Science in Moncton, together with Manon Mallet of the Gulf Fisheries Centre, demonstrates for the first time in this context how acceptance sampling by attribute, a technique formalized under the international ISO 2859 standard, can be adapted to make real-time, statistically defensible decisions about whether technical measures at a construction worksite are functioning as intended. The work arrives at a moment when environmental agencies around the world are under growing pressure to show that the conditions attached to permits and authorizations are not merely written on paper but enforced with rigor and transparency.
The central problem the researchers tackle is a familiar one in environmental management. When a road crosses a stream and the culvert must be replaced, the proponent installs an array of physical controls, including sandbag cofferdams, lined bypass channels, mulching, silt fences, and silt curtains, to keep disturbed sediment out of the watercourse. Regulations, standards, and codes of practice specify how these controls must be configured, inspected, and maintained. But knowing whether the installed system is actually meeting its water quality objective at any given moment is a different question from knowing whether the rules were followed. Traditional environmental monitoring, often built around before-after-control-impact designs, is designed to detect longer-term spatial and temporal effects and typically requires extensive data collected over the full duration of a project. That is too slow and too data-hungry for the practical needs of a construction site, where a failing silt fence needs to be identified and corrected today, not documented in a report two years later.
The authors draw a sharp and technically consequential distinction between two complementary activities. The first is a reliability analysis, which assesses how well a system of controls performs over time in order to inform the development of standards and codes of practice. Reliability analysis is a well-established engineering discipline, and the paper adapts the classic “bathtub curve” framework to environmental controls. In this framework, a system passes through an early period of adjustment during installation, a stable period in which it is expected to perform its intended function at a constant and relatively low failure rate, a wear-out period in which controls degrade and require repair, and, because natural systems face stochastic events such as heavy rainfall that can exceed design assumptions, catastrophic periods in which external factors overwhelm the controls entirely. The second activity, effectiveness verification, is fundamentally different in purpose and scale: it is a real-time onsite inspection meant to confirm, on the day of the inspection, that the installed configuration of controls is meeting the required environmental benchmark. Verification needs far fewer observations than reliability analysis, but it needs those observations to be statistically powerful enough to support a correct decision.
The case study grounding the paper is the replacement of two road stream crossings in Canada, at Queens Brook in 2021 and Kerr Brook in 2022, which had been the subject of a previous, data-rich reliability study by Goguen and colleagues. Automated data loggers with turbidity sensors were installed approximately 150 meters upstream and 60 meters downstream of each worksite, positioned 3 to 5 centimeters above the streambed to accommodate low summer water levels. The studies generated 4,331 and 14,589 turbidity data points respectively across 99 and 110 days of construction. The conformity attribute used to judge effectiveness derives from the Canadian Council of Ministers of the Environment water quality guidelines for total particulate matter: turbidity downstream of the worksite should not increase by more than 8 Nephelometric Turbidity Units above the upstream background level for short-term exposures of roughly 24 hours. Because turbidity is assumed not to change between the upstream sensor and the worksite, any increase recorded downstream, denoted as delta-Tu, is attributed to the worksite itself. Notably, although the 8 NTU threshold was occasionally exceeded during active works, those exceedances lasted only one to two hours, well within the guideline’s short-term allowance.
From this reliability data, the researchers calculated the level of non-conformity, meaning the proportion of measurements in which the turbidity increase exceeded 8 NTU, for each period of the bathtub curve. The weighted averages followed the expected pattern: 0.11 for the early period, 0.06 for the stable periods, then sharp rises to 0.60 for wear-out and 0.87 for catastrophic periods. Crucially, the stable-period average of 0.06 was adopted as the system performance quality level, or SPQL, a figure representing how well a well-implemented system of controls can realistically be expected to perform. This SPQL then anchors the entire sampling plan, because, as the authors argue, policies for acceptable and rejectable quality that ignore the achievable SPQL risk condemning functional systems as failures, inflating the burden on proponents without delivering any additional environmental protection.
The statistical machinery of the acceptance sampling plan is where the paper makes its most technically interesting contribution. In the environmental adaptation of ISO 2859, the proponent of the construction project plays the role of the producer, and the environment plays the role of the consumer. Type I Error, denoted alpha, becomes the proponent’s risk: the probability of wrongly concluding that the controls are ineffective when they are in fact working, which could trigger unwarranted penalties, delays, and costs. Type II Error, denoted beta, becomes the environment’s risk: the probability of wrongly concluding that the controls are effective when they are not, allowing sediment to flow into a fish-bearing stream unchecked. Using a hypothetical policy framework, the authors set alpha at 5 percent, beta at 10 percent, an acceptable quality level of 0.10, and a rejectable quality level of 0.20. From these values, the acceptance number, the maximum count of non-conformities tolerated in a sample before the system is declared ineffective, is calculated with the cumulative binomial distribution for candidate sample sizes of 5, 25, 110, and 500 observations.
The results deliver a striking lesson about statistical power. For a sample of only 5 observations, the probability of wrongly accepting a system operating at the rejectable quality level was 94 percent, meaning the environment would be left almost entirely unprotected; for 25 observations, the error probability was still 62 percent. Only samples of 110 and 500 observations kept the environment’s risk below the policy threshold of 10 percent, delivering detection power of 91 percent and 99.997 percent respectively. These findings are visualized through operating characteristic curves, which plot the probability of accepting a system across the full range of possible true non-conformity levels. The curves make the trade-offs visually explicit: a curve must pass above the intersection of the AQL and the proponent’s confidence level, and below the intersection of the RQL and the environment’s risk, for a sampling plan to satisfy policy. Smaller, cheaper inspections, the analysis shows, can quietly transfer nearly all of the risk onto the environment while appearing rigorous.
The authors also explore what happens when policy benchmarks are set without reference to reliability data. If the AQL and RQL were set at 0.10 and 0.20 while the true SPQL of the system was 0.26, the probability of accepting the system during inspection would collapse to just 0.3 percent, generating wave after wave of false failures for proponents whose controls are performing exactly as the applicable standards allow. This misalignment, they note, would be a signal that the AQL and RQL need to be recalibrated against a realistic SPQL. Equally important, they caution that effectiveness verification cannot stand alone. It must operate in tandem with conformity assessments, which check whether procedures, tasks, and maintenance requirements are being followed. A verification conducted during the wear-out period, for instance, would simply confirm that repairs are needed; and without the findings of a conformity assessment, a verification could be biased, as in the case of controls in visible disrepair that happen not to be causing turbidity increases during a dry spell.
In their discussion and conclusion, the researchers position the approach as a bridge between environmental protection policy and its practical implementation in a regulatory context. They emphasize that non-conformity levels are never zero even when a system works as intended, which is precisely why acceptance sampling uses an acceptance number rather than demanding perfection. They also stress that a complete sampling protocol must specify manual or automated data collection, sampling locations upstream and downstream of the worksite, and a minimum observation window of 24 hours to match the short-term turbidity benchmark. A low beta, they argue, provides a transparent, quantitative metric connecting field inspections to the objectives of environmental protection policies, giving regulators, certification bodies, and proponents a shared, defensible standard. The engineering techniques involved are decades old, but their application here, the authors suggest, could give environmental decision-making the same statistical discipline that has long underpinned industrial quality assurance, ensuring that when a worksite is declared in compliance, the declaration rests on a sample size and decision rule chosen to protect both the environment and the people working beside it.
Cite Scienmag News
Sloane Callahan. (September 3, 2026). Sampling Plans to Verify Erosion Controls Protecting Water Quality. Scienmag. https://scienmag.com/sampling-plans-to-verify-erosion-controls-protecting-water-quality/
Sloane Callahan. "Sampling Plans to Verify Erosion Controls Protecting Water Quality." Scienmag, 3 September 2026, https://scienmag.com/sampling-plans-to-verify-erosion-controls-protecting-water-quality/. Accessed 3 September 2026.
Sloane Callahan. "Sampling Plans to Verify Erosion Controls Protecting Water Quality." Scienmag. September 3, 2026. https://scienmag.com/sampling-plans-to-verify-erosion-controls-protecting-water-quality/


