


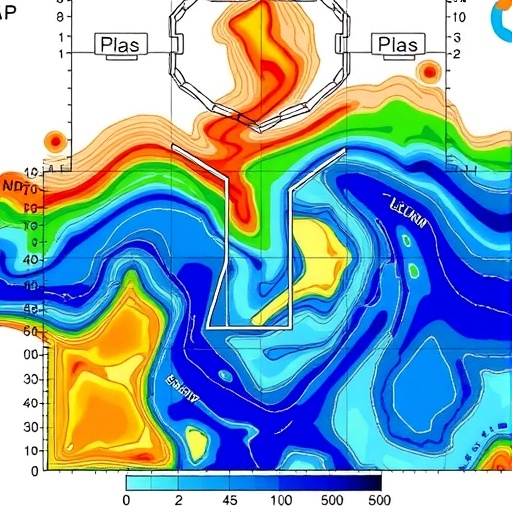
For decades, climate and water researchers have relied on a deceptively simple question: is a variable rising, falling, or staying the same over an entire historical record? A new study argues that this approach may be missing the most important part of the story. Introducing Rolling Window Innovative Trend Analysis, or RW-ITA, researchers have developed a method designed to reveal when hydro-meteorological systems change direction, enter new regimes, or begin accelerating—patterns that can disappear inside a single trend calculated across many decades. Published in Water Resources Management, the study applies the method to temperature, precipitation, evapotranspiration, and streamflow records, showing that environmental change is rarely a straight line. Instead, the climate and water signals examined by the researchers behave more like a moving target, shifting in strength and direction through time.
The central problem is statistical as much as environmental. Conventional trend analysis usually compresses a long time series into one summary result. A record spanning 80 or 90 years may produce a statistically significant upward or downward trend, but that result can conceal several contrasting phases. A period of cooling may be averaged together with later warming; a temporary rise in streamflow may be blended with decades of decline; and short-lived reversals may vanish entirely. RW-ITA addresses this limitation by dividing the record into overlapping windows and analyzing each segment separately. In the study, the researchers used 30-year and 20-year windows, shifting each window by one year at a time. Every new calculation therefore shares most of its data with the previous one, creating a continuous view of how the apparent trend evolves rather than a single verdict for the whole record.
The method builds on Innovative Trend Analysis, a graphical and statistical technique introduced by Zekai Şen. In its traditional form, a time series is divided into two consecutive parts, which are independently ranked and compared on a scatter diagram. If the points cluster around the 1:1 line, the series shows little overall change; if they lie predominantly above or below it, an increasing or decreasing tendency is indicated. RW-ITA extends that concept by repeating the comparison inside a sequence of moving windows. The result is a time-resolved map of trend behavior. The researchers also incorporated a calibrated significance test, allowing them to distinguish visually apparent changes from trends strong enough to exceed specified confidence limits. This is crucial because a changing pattern is not automatically a statistically reliable one, especially in noisy environmental records with natural variability and serial dependence.
Temperature delivered one of the clearest demonstrations of why a moving-window approach matters. Rather than revealing a uniform rise throughout the historical record, the analysis identified three distinct phases. The earliest period, extending from 1929 into the 1950s, showed an initial warming tendency that was not statistically significant. That was followed by a mid-century cooling phase lasting into the 1970s. From approximately the mid-1970s onward, the direction changed decisively, with warming becoming sustained and increasingly pronounced. According to the study, trends exceeded the 99% confidence intervals from the 1980s, indicating that the later warming signal was not merely a continuation of the weak early-century tendency. The rolling analysis therefore transforms a broad statement—“temperature increased over the full record”—into a more informative chronology of hesitation, reversal, and acceleration.
Precipitation told a different story, underscoring that climate variables do not necessarily change together. The rolling windows revealed oscillatory behavior, with alternating periods of significant increases and decreases. Such a pattern is difficult to summarize with a single long-term slope because the average may appear weak even when the system has undergone repeated and meaningful transitions. For water managers, this distinction matters. A stable long-term average can coexist with decades of increasingly irregular rainfall, shifts in wet and dry periods, or changes in the timing of precipitation. The study’s results suggest that a basin can experience a sequence of hydrologically important reversals without producing an obvious whole-series trend. RW-ITA makes those reversals visible by showing when the direction changes and whether each phase reaches statistical significance.
Evapotranspiration, the combined transfer of water to the atmosphere through evaporation and plant transpiration, also displayed a complex evolution. The analysis identified three broad phases, but the shorter 20-year windows exposed a particularly striking recent reversal. Between 1996 and 2020, evapotranspiration shifted sharply toward a decreasing trend. That finding might be overlooked or weakened when assessed with a longer window, because a 30-year segment retains more information from earlier conditions and consequently produces a more stable but less responsive estimate. The contrast illustrates the method’s scale-dependent behavior. Longer windows reduce sensitivity to short-term fluctuations and can provide a robust picture of persistent change. Shorter windows, by contrast, react faster to turning points, making them valuable for detecting emerging changes that could become important for agriculture, ecosystem health, drought development, and reservoir operations.
The most consequential result involved streamflow. The rolling analysis identified what the researchers describe as a fundamental hydrological regime shift during the mid-1970s. Before that transition, streamflow showed a weak and statistically non-significant upward tendency. Afterward, the direction changed to a sustained and significant decline that continued through 2018. This is not simply a matter of a trend becoming slightly steeper; it represents a transformation in the behavior of the river system. Streamflow integrates the effects of precipitation, temperature, evapotranspiration, snow processes, soil moisture, land conditions, and human influence. A persistent decline may therefore signal a changing balance between water entering a basin and water leaving it, with direct consequences for water supply reliability, irrigation, hydropower generation, ecological flows, and flood-and-drought planning.
The study goes further by applying RW-ITA at a monthly scale, revealing seasonal signatures that annual analysis can conceal. Monthly rolling windows showed that streamflow’s mid-1970s transition appeared with remarkable consistency across all months. That consistency strengthens the interpretation that the shift was not confined to one season or caused solely by a temporary change in the timing of runoff. Seasonal analysis is particularly important in a warming climate because annual totals may remain relatively stable while the distribution of water through the year changes dramatically. A river could receive similar yearly inflow but experience lower summer discharge, earlier spring runoff, or longer periods of ecological stress. By examining each month through successive windows, RW-ITA provides a more detailed view of when a change occurs and whether it affects the full seasonal cycle.
The researchers emphasize that the method is not intended to replace established tools such as the Mann–Kendall test, Sen’s slope estimator, or formal change-point procedures. Instead, it offers a complementary framework for exploring the temporal structure of trends before decisions are made. Its strengths lie in identifying hidden phases, comparing responses at different window lengths, and linking annual patterns with monthly behavior. Its results should still be interpreted carefully, particularly because overlapping windows are not independent observations and repeated testing can increase the chance of false discoveries if significance is not properly calibrated. The study’s authors acknowledge the need for responsible statistical interpretation, while arguing that ignoring non-stationarity may be an even greater risk when the goal is to understand environmental systems undergoing rapid change.
The broader message is likely to resonate far beyond the records examined in this research: climate change is not experienced as one smooth, universal trend. It arrives through reversals, accelerations, regional contrasts, seasonal disruptions, and regime shifts. A method that can distinguish a weak early warming phase from later rapid warming, or a temporary streamflow increase from a multi-decade decline, offers a potentially valuable lens for adaptation planning. RW-ITA could help agencies test whether infrastructure assumptions remain valid, identify emerging water shortages earlier, and design management strategies that can adjust as conditions evolve. By turning a static trend into a moving narrative, the method gives researchers and decision-makers a clearer warning: the average behavior of the past may no longer describe the system they must manage in the future.
Cite Scienmag News
Violet Maxwell. (August 26, 2026). RW-ITA Reveals Hidden Trends in Hydro-Meteorological Variables Through Rolling-Window Analysis. Scienmag. https://scienmag.com/rw-ita-reveals-hidden-trends-in-hydro-meteorological-variables-through-rolling-window-analysis/
Violet Maxwell. "RW-ITA Reveals Hidden Trends in Hydro-Meteorological Variables Through Rolling-Window Analysis." Scienmag, 26 August 2026, https://scienmag.com/rw-ita-reveals-hidden-trends-in-hydro-meteorological-variables-through-rolling-window-analysis/. Accessed 6 September 2026.
Violet Maxwell. "RW-ITA Reveals Hidden Trends in Hydro-Meteorological Variables Through Rolling-Window Analysis." Scienmag. August 26, 2026. https://scienmag.com/rw-ita-reveals-hidden-trends-in-hydro-meteorological-variables-through-rolling-window-analysis/


