


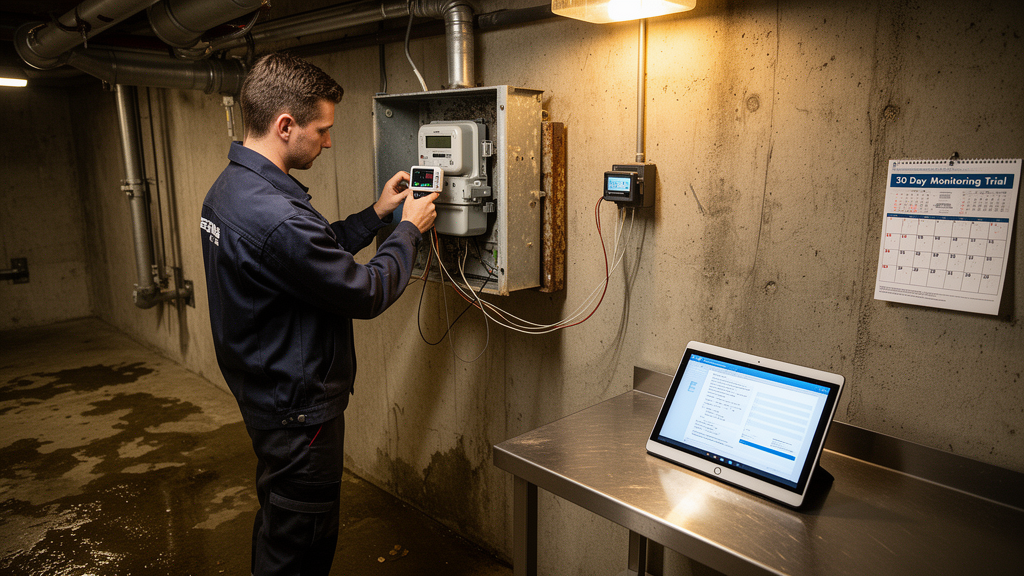
An installed industrial electricity meter was connected to a monitoring system that acquired, stored and remotely displayed operating data from a three-phase induction motor during a 30-day evaluation in an industrial training workshop in Peru. The architecture used Node-RED, open-source visual programming software, and Modbus TCP to communicate with an Allen-Bradley PowerMonitor 500 over Ethernet. During 240 scheduled monitoring hours, the system generated all 7,200 expected observations at two-minute intervals. After six isolated rows were excluded, 7,194 observations, or 99.917% of the acquired dataset, remained for descriptive analysis.
The applied, descriptive and non-comparative study took place in Electrotechnics Laboratory 402 at SENATI Chimbote in Nuevo Chimbote, Áncash, Peru. The monitored load was a 7.5-horsepower, three-phase alternating-current induction motor installed in one of the facility’s electrical-machine training modules. The motor was operated only during scheduled weekday sessions, from 08:00 to 12:00 and 13:00 to 17:00, with no recording during the midday break, evenings, nights or weekends. Each four-hour session was expected to produce 120 observations, giving 240 records per monitoring day and 7,200 across the 30 effective days. The investigators did not introduce an intervention intended to reduce electricity consumption, and the results do not characterize the motor outside those scheduled operating periods.
The implementation had four principal components: the existing PowerMonitor 500, an HP EliteOne computer acting as a local gateway, a Node-RED flow for acquisition, decoding and storage, and a dashboard accessible locally and through the internet. The meter communicated directly with the gateway using a Category 5 twisted-pair Ethernet cable and static addresses on the 192.168.0.x subnet. Node-RED queried read-only holding registers through Modbus TCP function code 03, combined the decoded variables into structured observations, updated the dashboard and wrote daily files with semicolon-separated fields. Remote-RED established an outbound tunnel for remote visualization, while the historical CSV data and consolidated dataset remained stored on the local gateway computer.
Five instantaneous variables were analyzed: L1–L2 voltage, L1 current, L1 active power, L1 power factor and frequency. Although current transformers were connected to all three phases, the Node-RED configuration deliberately read only the L1 current, active-power and power-factor registers. L2 and L3 current, active power and power factor were not acquired, so the system did not verify phase balance or directly measure total three-phase active power or total three-phase power factor. Voltage and frequency were common measurements. Each selected quantity occupied two 16-bit registers and was reconstructed as a 32-bit IEEE 754 floating-point value, with the first returned word treated as the least significant word and the second as the most significant word. L1 active power was converted from watts to kilowatts by dividing the decoded value by 1,000.
The original Node-RED flow also included a cumulative energy variable, but the researchers excluded it from the statistical analysis because its decoding from four 16-bit registers could not be independently verified. Before data collection began, investigators checked communication with the meter, responses from the selected registers, decoding of the five variables, dashboard updates, CSV-file generation, timestamp correspondence and access to the dashboard from both local and remote connections. They then screened the consolidated observations using thresholds established for the operating conditions: voltage below 180 volts or above 260 volts, current above 50 amperes, and frequency below 57 or above 63 hertz. These limits were screening criteria rather than regulatory or metrological thresholds.
Six isolated rows breached at least one threshold. They included two L1 current readings of 182.6 and 191.8 amperes, roughly ten times the mean of 18.96 amperes; one L1–L2 voltage reading of 2,109.3 volts, roughly ten times the mean of 220.03 volts; and three frequency readings of 50.89, 50.95 and 50.97 hertz. None of the abnormalities persisted in the immediately preceding or following observations. The pattern was consistent with possible intermittent word-order errors during reconstruction of 32-bit IEEE 754 values over Modbus TCP rather than with genuine electrical transients, but the specific cause of each outlier was not independently verified. The researchers excluded all six complete rows to preserve temporal alignment among the five variables and did not impute replacement values.
Among the 7,194 retained observations, mean L1 active power was 5.25 kilowatts, with a coefficient of variation of 2.64%, a minimum of 5.01 kilowatts and a maximum of 5.55 kilowatts. Mean L1 current was 18.96 amperes, with a median of 18.99 amperes, a range of 17.62 to 20.12 amperes and a coefficient of variation of 2.92%. L1–L2 voltage averaged 220.03 volts, with a standard deviation of 2.94 volts and a coefficient of variation of 1.34%. Frequency had an unrounded mean of 59.9995 hertz, a range of 59.82 to 60.18 hertz and the lowest coefficient of variation among the five variables, at 0.08%. Mean L1 power factor was 0.7213, with a median of 0.723, a range of 0.70 to 0.75 and a coefficient of variation of 1.39%.
The mean L1 power factor was 19.86% below the reference value of 0.90 adopted for descriptive comparison. That comparison does not establish metrological error, regulatory noncompliance or the motor’s total three-phase power factor, particularly because phases L2 and L3 were not recorded and the meter was never independently compared with a calibrated reference instrument. The authors estimated that the motor operated at about 94% of its approximately 5.59-kilowatt rated capacity by treating measured L1 active power as representative of total active power under an assumption of balanced three-phase operation that was not verified. The estimate also did not account for motor efficiency, and the nameplate power factor for the specific motor was unknown. Harmonics, heating, vibration and insulation condition were likewise not assessed, so the observed phase-specific value cannot establish an equipment anomaly or show that power-factor correction would be beneficial.
The low dispersion of the retained measurements indicates that the motor maintained a relatively consistent operating point during the scheduled workshop sessions. On an illustrative operating day, L1 active power remained approximately between 5.0 and 5.5 kilowatts, with small fluctuations during the morning and afternoon monitoring blocks. Grouping the retained observations by acquisition time across the 30 days also produced an average profile close to the overall 5.25-kilowatt mean. These observations apply to one motor under controlled training conditions and do not characterize startup, shutdown, standby, nighttime, weekend or unplanned operation. The trial also did not test whether access to the dashboard influenced operator behavior, maintenance decisions or energy consumption, and it did not measure whether the generated information produced measurable savings or improved motor performance.
The principal result was operational feasibility rather than improved energy performance. Reusing the installed meter, an available computer and the local network reduced the need for additional sensing hardware and proprietary visualization software. The evaluation nevertheless did not establish communication availability, energy savings, cost savings, metrological accuracy or economic superiority. Although every scheduled record was generated, latency, packet loss, response time, downtime and mean time between failures were not measured, so acquisition completeness was not interpreted as a formal availability metric. Scalability also remained untested because the system served only one meter and one motor. Security was not treated as a production requirement in the prototype: the meter and gateway occupied an isolated local network, while the outbound Remote-RED tunnel avoided inbound firewall port forwarding and a public address on the gateway. Modbus TCP has no native encryption or authentication, and no additional security layer was installed. For production deployment, the authors identified VPNs, Modbus/TLS, MQTT over TLS, access controls and formal cybersecurity assessment as necessary considerations, alongside read validation, calibrated comparison instruments, full three-phase collection and comprehensive communication metrics.
Subject of Research: Operational evaluation of infrastructure-reuse electrical monitoring for an industrial three-phase motor
Article Title: Infrastructure-reuse electrical monitoring using Node-RED and modbus TCP: a 30-day operational evaluation of an industrial three-phase motor
Article References: Vargas Chacón, W. B., Cuba Vargas, K. E., & Olivera Ylla, C. A. (2026). Infrastructure-reuse electrical monitoring using Node-RED and modbus TCP: a 30-day operational evaluation of an industrial three-phase motor. Frontiers in Energy Research, 14, 1952841. https://doi.org/10.3389/fenrg.2026.1952841
Image Credits: AI Generated
DOI: 10.3389/fenrg.2026.1952841
Keywords: industrial monitoring, Node-RED, Modbus TCP, electrical measurement, three-phase motor, infrastructure reuse, data acquisition, power factor, industrial instrumentation, open-source systems, Infrastructure-reuse, electrical
Cite Scienmag News
Denise Maddox. (October 21, 2026). Reused Industrial Meter Feeds 30-Day Electrical Monitoring Trial. Scienmag. https://scienmag.com/reused-industrial-meter-feeds-30-day-electrical-monitoring-trial/
Denise Maddox. "Reused Industrial Meter Feeds 30-Day Electrical Monitoring Trial." Scienmag, 21 October 2026, https://scienmag.com/reused-industrial-meter-feeds-30-day-electrical-monitoring-trial/. Accessed 21 October 2026.
Denise Maddox. "Reused Industrial Meter Feeds 30-Day Electrical Monitoring Trial." Scienmag. October 21, 2026. https://scienmag.com/reused-industrial-meter-feeds-30-day-electrical-monitoring-trial/


