Recycled plastic bottles could soon be doing more than clogging landfills. A research team in China has shown that polyester fibers recovered from PET waste can reinforce a high-performance mortar used in prefabricated steel-truss floor panels, and that the mixture itself can be designed with an explicit probability of success rather than a single optimistic point estimate. The study, published in Results in Engineering, blends designed experiments, Gaussian-process statistics, conformal prediction and distributionally robust optimization into a workflow that asks a deceptively simple question: how likely is it that a chosen mortar mix will satisfy strength, shrinkage, water-loss and workability requirements all at once?
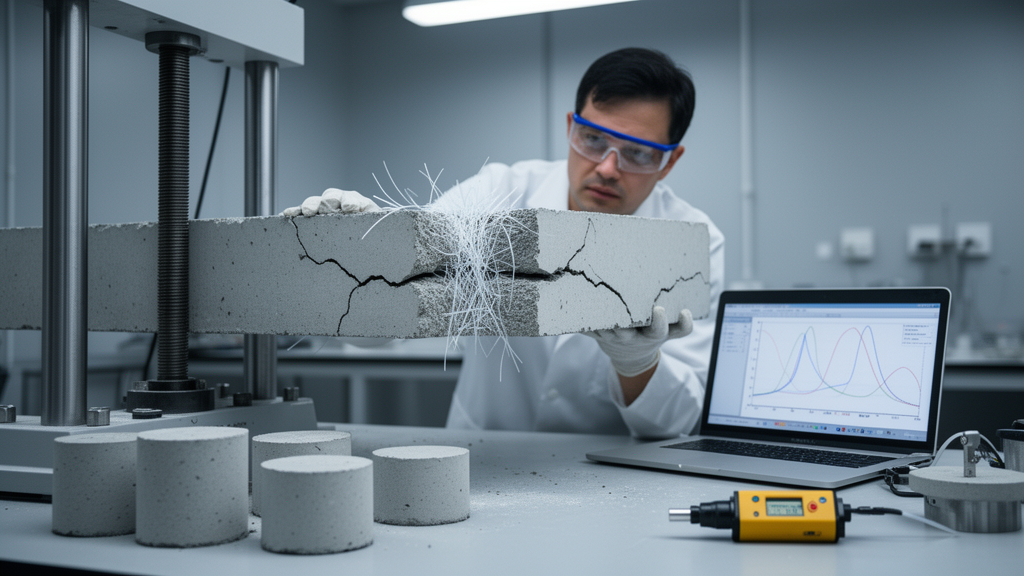
The material at the center of the campaign is a PET fiber mortar. The binder was a ternary blend of ordinary Portland cement, rapid-hardening sulfoaluminate cement and Class F fly ash, with undensified silica fume as a densifying admixture. The fiber was a virgin polyester monofilament 6 mm long, with a tensile strength of 616 MPa, an elastic modulus of 5620 MPa and an elongation at break of 23 percent. Hydroxypropyl methylcellulose regulated water retention, a polycarboxylate-ether superplasticizer controlled dispersion, and natural medium sand served as fine aggregate at a binder-to-sand ratio of roughly 1:2.5 and a water-to-binder ratio of 0.33. Each cubic meter of the base mix contained 395 kg of Portland cement, 44 kg of sulfoaluminate cement, 132 kg of fly ash and 1460 kg of sand.
Four admixture-level factors were varied in a four-factor, three-level Box-Behnken design of 27 runs: PET fiber dosage from 0.9 to 1.5 kg per cubic meter, superplasticizer from 3 to 7 per mille of binder mass, cellulose ether from 0.3 to 0.7 per mille, and silica fume from 13 to 31 kg per cubic meter. Six responses were measured per run: 28-day compressive strength, 28-day flexural strength, 7-day and 28-day drying shrinkage, 28-day water loss rate, and fresh flowability assessed with a truncated-cone flow-table test. The maximum measured compressive strength reached 56.76 MPa. The placement target for the manufacturing process was a flow spread near 180 mm, enough to let the steel truss be pressed into position without sinking to the bottom of the panel.
The original campaign used the classic Derringer-Suich desirability construction, mapping each predicted response onto an individual desirability score between zero and one and aggregating them through a weighted geometric mean. The reported optimum lay at a PET dosage of 1.500 kg per cubic meter, a superplasticizer dose of 6.881 per mille, a cellulose ether dose of 0.700 per mille and a silica fume dosage of 27.176 kg per cubic meter, with an overall desirability of 0.768. A three-specimen validation batch confirmed all six point predictions within 5 percent of the response-surface predictions. That deterministic reference establishes local agreement between predictions and one measured batch, but it does not quantify the probability that all six responses will meet their criteria simultaneously in a future mix.
To address that gap, the team built a multi-output Gaussian process with intrinsic coregionalization, coupling the six standardized response functions through a task-covariance matrix and a shared Matérn-5/2 kernel with one lengthscale per coded factor. At any candidate mix the model returns a posterior mean vector and covariance matrix, and adding modeled observation noise gives the predictive distribution of a future run-summary vector. Integrating that distribution over the stated six-response event produces a probability field over the entire four-factor design box rather than a single value at the desirability optimum. Because the six events are correlated through the joint covariance, the satisfaction probability has no closed form and is estimated by Monte Carlo simulation with hundreds of thousands of common Gaussian draws.
The fitted ARD lengthscales of approximately 8.89, 6.32, 18.66 and 9.68 coded units exceed the side length of the design box, so the latent response surfaces vary smoothly over the experimental domain. Structural sensitivity comparisons show how the joint assessment depends on the covariance representation. Under the same Matérn-5/2 kernel and a lengthscale upper bound of 30 coded units, the future-observation probability at the desirability optimum was 0.809 for rank 1, 0.927 for rank 2, 0.931 for rank 3 and 0.916 for rank 6. Changing the kernel to Matérn-3/2 gave 0.890, an RBF kernel gave 0.858, and restricting the lengthscale upper bound to 3 coded units dropped the probability to 0.629. These comparisons describe structural sensitivity rather than an empirical selection rule.
The team then compared nine surrogate families and two ensembles under a common outer-excluded error rule. Each of the 27 outer folds removes the same test run for every entry, with scaling, variable selection, likelihood fitting and prediction using only the remaining 26 rows. The pool spans quadratic response surfaces, regularized polynomials, support vector regression, random forest, XGBoost, independent Gaussian processes, the multi-output coregionalization model and sparse polynomial chaos expansion, together with pseudo-Bayesian model averaging and stacking. Different families performed best on different responses: support vector regression had the lowest outer leave-one-out RMSE for compressive strength and water loss, the multi-output Gaussian process for flexural strength and both shrinkage responses, and stepwise response surface methodology for flowability. Full quadratic RSM remained competitive for compressive strength, water loss and flowability, with coefficients of determination of 0.957, 0.921 and 0.974 respectively.
Under the fixed one-sided 5 percent relative event, the eight prediction-qualified entries placed the original robust candidate F01 among the best locations found over the entire four-factor box, with an empirical scenario attainment of 16 out of 27. The desirability optimum F02 and the model-form candidate F03 gave 15 and 10 out of 27 respectively. With all eleven entries included, the best found minimum dropped to only 3 out of 27, showing how a worst-case recommendation depends on the predictive quality and diversity of the models in the pool. Joint prediction-set diagnostics using a foldwise maximum-score jackknife+ construction included 25 of 27 joint response vectors at alpha 0.10 and 26 of 27 at alpha 0.05, with theoretical lower bounds of 0.80 and 0.90 under exchangeability. Split-mean and split-conformalized quantile regression methods gave comparable inclusion counts but wider intervals, particularly for the quantile approach, which produced a mean compressive-strength interval width of 17.8 MPa.
The 21 historical independently mixed batches at 12 formulations provided measured outcomes for comparing candidates. Under the fixed six-response benchmark, the repeated F01, F02 and F03 series achieved 3 of 3, 5 of 6 and 1 of 3 joint successes. Twenty of the 21 records satisfied the compressive-strength threshold, but only 14 satisfied all six thresholds simultaneously. The single-batch comparison at F09 illustrates the trade-off: its measured compressive strength of 54.33 MPa exceeded the values in the F01 series, but its 28-day shrinkage of 0.0490 percent and flow of 171 mm both fell outside the corresponding limits of the fixed relative event. A high-strength location can therefore expose a drying or fresh-state compromise that is less apparent in the aggregate desirability score.
The continuous-domain integration of the frozen future-observation field estimated the region with attainment at least 0.9 at 0.000659 percent of the design-box volume, with an at-least-95 percent simultaneous numerical interval of 0.000593 to 0.000763 percent. This narrow window quantifies spatial-sampling and inner-integration uncertainty conditional on the fitted model, not model-estimation or physical-process uncertainty. The team also examined published confirmation cases from grout, 3D-printing mortar and coal-mine backfill studies, with mean absolute percentage errors of 2.72 to 8.32 percent. In the 3D-printing case, favorable point predictions and successful buildability were reported, but the measured flow of 147.5 mm fell below the selected 150 to 180 mm optimization window, illustrating that a workflow checking both margins would flag flow for confirmation before adopting the formulation. In the backfill case, strength predictions agreed closely with confirmation measurements, yet the source found the strength insufficient for the intended application and adjusted the binder proportions. Accurate prediction of an optimum therefore remains distinct from meeting application requirements.
At the author-supplied prices, the historically supported robust candidate F01 has a listed product cost of approximately 69.21 yuan per square meter, close to the 69.24 yuan per square meter for the desirability choice F02. The calculated material-cost difference and break-even condition relate the multiresponse screening decision to the additional expenditure and quality outcomes needed to justify implementation. Over 10,000 square meters, the material-cost difference between F01 and F02 amounts to 276.84 yuan, so expenditure above that amount would require an independently supported benefit in quality or decision making. The recorded single-thread implementation takes approximately 139 seconds for nested fitting of the eleven entries, 84 seconds for full-domain searches and 141 seconds for continuous volume integration. Computation takes minutes; specimen preparation and 28-day testing determine the experimental schedule.
The study concludes that joint-response analysis complements desirability optimization by distinguishing favorable mean responses from simultaneous attainment under stated uncertainty assumptions. The 27-run PET-mortar campaign provides a common experimental basis for comparing these two aspects of formulation performance, and the 21 historical batches show practical trade-offs across 12 formulations. Observation-noise treatment, model structure and response dependence materially affect predicted joint attainment. Three published confirmation cases extend the quantitative comparison to other mixture applications, and the placement target near 180 mm relates the present study to steel-truss floor-panel manufacture. The workflow informs mixture selection and confirmation, while product conformity requires evidence from the corresponding product tests.
Subject of Research: Probabilistic reliability assessment and robust design of PET fiber mortar
Article Title: Probabilistic reliability assessment and robust design of PET fiber mortar
Article References: Probabilistic reliability assessment and robust design of PET fiber mortar. (n.d.). https://doi.org/10.1016/j.rineng.2026.113414
Image Credits: AI Generated
DOI: 10.1016/j.rineng.2026.113414
Keywords: Probabilistic, reliability, assessment, robust, design, fiber, mortar, scientific research
Cite Scienmag News
Denise Maddox. (October 16, 2026). Probabilistic reliability assessment and robust design of PET fiber mortar. Scienmag. https://scienmag.com/probabilistic-reliability-assessment-and-robust-design-of-pet-fiber-mortar/
Denise Maddox. "Probabilistic reliability assessment and robust design of PET fiber mortar." Scienmag, 16 October 2026, https://scienmag.com/probabilistic-reliability-assessment-and-robust-design-of-pet-fiber-mortar/. Accessed 16 October 2026.
Denise Maddox. "Probabilistic reliability assessment and robust design of PET fiber mortar." Scienmag. October 16, 2026. https://scienmag.com/probabilistic-reliability-assessment-and-robust-design-of-pet-fiber-mortar/