


A year of ambient monitoring found that PFAS contamination in Queensland surface water was concentrated around major cities and largely absent from many regional and remote sites. Researchers analysed 30 perfluoroalkyl substances in samples collected every two months from 54 sites along the state’s eastern coast between May 2019 and March 2020. PFOS, the most frequently reported compound, was detected in 53% of all samples and at 45 of the 54 sites, while nine sites produced no reported PFAS above the laboratory limit of reporting during any of the six monitoring rounds. The findings suggest that the presence and chemical composition of PFAS vary markedly across Queensland rather than forming a uniform background contamination signal.
The study, an ambient-monitoring assessment rather than an investigation centred on known contamination sites, directly tested the assumption that commonly analysed PFAS are invariably present in surface waters. Concentrations were highest in waters adjacent to major urban and industrial areas, where mean total PFAS reached as much as 63 ng L−1 at one site. Levels were lower in inner and outer regional areas and lowest in remote locations. Of the 30 compounds targeted, 16 were not reported above the reporting limit at any site during the year. Nine sites with no reported PFAS lay in inner regional, outer regional and remote areas, while the nine sites where compounds other than PFOS appeared were all in major cities except for Vines Creek, an inner-regional site near an industrial estate, wastewater treatment plant and landfill in Mackay.
PFOS showed a measured range of less than 0.1 to 0.4 ng L−1 in remote areas, less than 0.1 to 0.6 ng L−1 in outer regional areas, less than 0.1 to 4.7 ng L−1 in inner regional areas and less than 0.1 to 37.0 ng L−1 in major cities. At 10 of the 45 sites where PFOS was reported, it appeared in fewer than half of the samples and at concentrations close to or at its 0.1 ng L−1 limit of reporting. PFOS was the only compound reported at 32 sites outside the major-city class, and most of those measurements were near the reporting limit. The study authors cautioned that PFOS had an order-of-magnitude lower reporting limit than the other PFAS, a difference that may partly explain why it was reported more frequently.
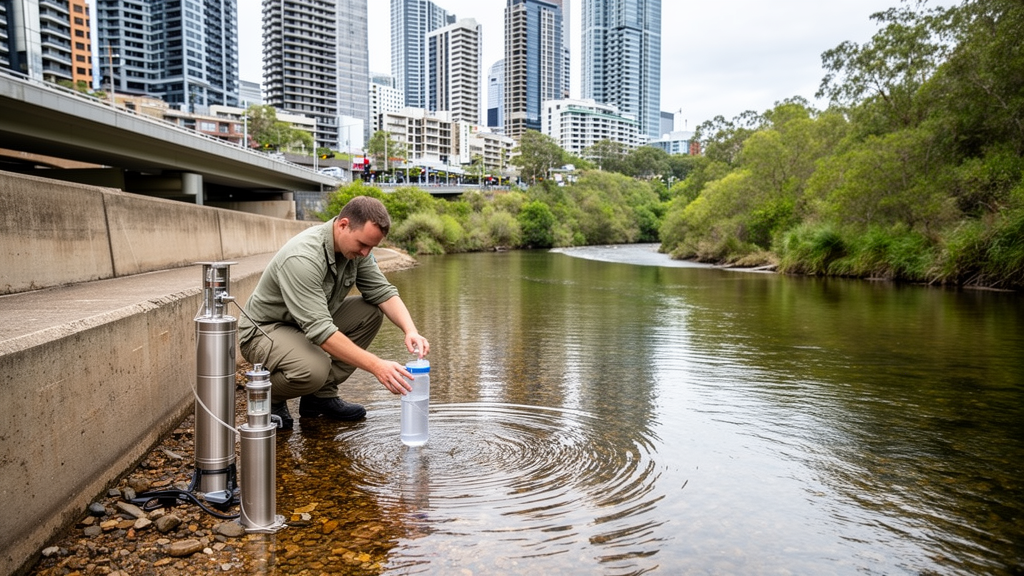
The monitoring network spanned six freshwater sites, one lake or reservoir, 42 estuarine sites and five coastal sites. Every location was at least 1 km from a wastewater treatment plant or another known PFAS point source, following guidance for global monitoring of persistent organic pollutants. Sites were selected to represent major-city, inner-regional, outer-regional and remote classifications across the eastern coast; 11 were in major cities, 26 in inner regional areas, nine in outer regional areas and eight in remote areas, with no very remote sites included. Surface-water grab samples were taken just below the surface at estuarine sites on an outgoing tide. Field and transport blanks and duplicate samples supported laboratory quality control, while an interlaboratory laboratory checked duplicates.
Each sample was analysed for 30 commonly examined PFAS by an accredited laboratory at the lowest available reporting limit. The investigators combined the concentration data with measurements of pH, turbidity, electrical conductivity, dissolved oxygen, temperature and salinity, as well as landscape and source-related variables. These included distance to the nearest known potential source, the number of licensed waste-management activities and wastewater treatment plants in the catchment, catchment population, catchment size, elevation, rainfall during the 30 days before collection, and remoteness class. Population estimates were calculated at two spatial scales, including a smaller catchment of roughly 150 km², so the analysis could consider both nearby populations and the wider area draining toward each site.
Spatial analysis identified several factors associated with PFOS concentrations. The strongest site-level correlation was with population in the smaller catchment, with a Spearman correlation coefficient of 0.71. PFOS was also associated with distance from the nearest known potential source, for which the correlation was −0.66, and with the number of waste-management activities in the catchment, at 0.60. The directions and significance of these associations persisted under different treatments of results below the reporting limit. A multivariable model containing remoteness class and population density had an adjusted R² of 0.63, indicating that the two variables together accounted for 63% of the observed variation in site-level PFOS after adjustment. These statistical relationships do not by themselves establish causation, but they are consistent with greater proximity to human infrastructure in densely settled areas.
Urban sites nevertheless displayed substantial local differences. Some locations near the Gold Coast and at the mouth of the Brisbane River had very low PFAS levels or none above the reporting limit. The researchers proposed that strong water movement and flushing in coastal estuaries may dilute contaminants, particularly where potential sewage discharge points are offshore. In contrast, upstream sites in the Brisbane River experienced longer residence times and had higher concentrations. Oxley Creek and the Brisbane River at Indooroopilly were directly linked by their geography: the river site was downstream of the Oxley Creek wastewater treatment plant discharge and about 3 km upstream of the creek’s confluence with the river. These site-specific hydrological conditions help explain why proximity to a city did not translate into a uniform concentration pattern across urban waters.
Three sites exceeded the Australian and New Zealand default guideline value of 20 ng L−1 for PFOS, a value intended to protect 99% of aquatic species: Brisbane River at Indooroopilly reached 37 ng L−1, Oxley Creek reached 30 ng L−1 and Mary River at Maryborough reached 21 ng L−1. The Mary River result was an anomaly because PFOS was at or below the 0.5 ng L−1 interim screening threshold, or below the reporting limit, during every other monitoring round, and its source was not identified. Nine sites had no reported PFOS, and 26 had maximum concentrations below the interim screening threshold. Seventeen sites exceeded that threshold but remained below the stricter default guideline value. Sites with PFOS above the threshold were confined to major-city and inner-regional classes; neither outer-regional nor remote sites exceeded it.
Monitoring also captured different temporal patterns at individual locations rather than a single statewide trend. PFAS increased during the dry season at the Brisbane River’s Karana Downs site and in the Caboolture River. Both are tidal estuaries about a kilometre upstream from licensed sewage discharge points, and both experience their greatest flow during the wet season; the researchers identified effluent discharge as a possible contributor to dry-season accumulation. Oxley Creek and Brisbane River at Indooroopilly instead showed wet-season increases, which the authors associated with stormwater runoff from industrial areas and wet-weather wastewater releases. Tingalpa Creek showed no clear seasonal pattern, possibly reflecting its multiple upstream sources. An opportunistic Bramble Bay sample taken after heavy rain contained approximately six times the total PFAS seen in other months and included PFPeA, PFHxA, PFOA and PFHxS in addition to PFOS.
The authors emphasised several limitations in interpreting the statewide picture. The network was weighted toward coastal and estuarine sites because locations were drawn from an existing monitoring program, leaving only six freshwater sites and limited representation farther inland. Some laboratory reporting limits were higher than those in newer literature, and the number of PFAS described and analysed has continued to grow. The seasonal analysis was possible at only six South East Queensland sites that had at least one PFAS reported in every sampled month, so the observed wet- and dry-season patterns should be interpreted as site-specific responses rather than evidence of a general Queensland cycle. Unrecorded septic systems, recycled-water irrigation, biosolid and pesticide applications, and potential atmospheric deposition could also influence results. Longer monitoring across more freshwater and inland sites, together with more complete source records, will be required to determine how widely the observed patterns extend across Queensland.
Subject of Research: Ambient monitoring of 30 PFAS across 54 surface-water sites along Queensland’s eastern coast.
Article Title: Not everywhere, not always: 30 targeted PFAS in ambient surface waters of Queensland, Australia
Article References: Baddiley, B., Myburgh, A., & Vardy, S. (2026). Not everywhere, not always: 30 targeted PFAS in ambient surface waters of Queensland, Australia. Environmental Monitoring and Assessment, 198(11), Article 1232. https://doi.org/10.1007/s10661-026-16030-5
Image Credits: AI Generated
DOI: 10.1007/s10661-026-16030-5
Keywords: PFAS, PFOS, Queensland, surface water, ambient monitoring, environmental contamination, urban pollution, water chemistry, Australia, remoteness, everywhere, always
Cite Scienmag News
Violet Maxwell. (October 20, 2026). PFAS concentrations track Queensland’s cities, not every waterway. Scienmag. https://scienmag.com/pfas-concentrations-track-queenslands-cities-not-every-waterway/
Violet Maxwell. "PFAS concentrations track Queensland’s cities, not every waterway." Scienmag, 20 October 2026, https://scienmag.com/pfas-concentrations-track-queenslands-cities-not-every-waterway/. Accessed 20 October 2026.
Violet Maxwell. "PFAS concentrations track Queensland’s cities, not every waterway." Scienmag. October 20, 2026. https://scienmag.com/pfas-concentrations-track-queenslands-cities-not-every-waterway/


