


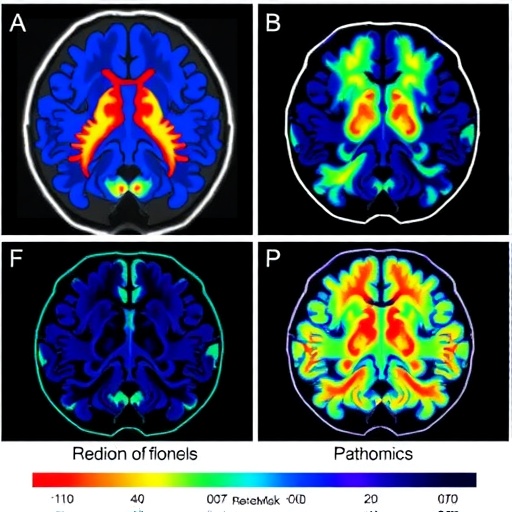
For patients diagnosed with high-grade gliomas, the most aggressive form of primary brain cancer, one of the most urgent clinical questions is deceptively simple: who will progress within a year, and who will not? A new study published in Annals of Clinical and Translational Neurology offers what its authors describe as a more powerful answer than any existing single-method approach, by teaching artificial intelligence to read two very different portraits of the same tumor at once. By fusing quantitative features extracted from preoperative magnetic resonance imaging with machine-learned patterns hidden in digitized pathological slides, researchers constructed a combined predictive model that substantially outperformed models built on imaging, pathology, or clinical data alone, achieving a concordance index of 0.883 in their training cohort and 0.840 in a held-out test cohort.
The clinical stakes are high. According to data cited by the researchers from the Chinese Society of Oncology, brain gliomas occur at an annual rate of 6.4 per 100,000 people, making them the most common primary malignant tumor of the adult central nervous system. High-grade gliomas, encompassing World Health Organization grades 3 and 4, account for roughly 74.2 percent of these tumors. Despite maximal surgical resection, radiotherapy, temozolomide chemotherapy, and tumor-treating fields, five-year overall survival remains trapped between 6.6 and 30.9 percent. Critically, prior research shows that patients whose disease progresses within the first year fare markedly worse, which makes identifying that subgroup before or shortly after treatment a central goal of personalized neuro-oncology. In the study cohort itself, patients who did not progress within a year had a median progression-free survival of 31 months compared with just 8 months for those who did, and median overall survival of 56 versus 15 months.
The technical heart of the study lies in two complementary ways of quantifying tumor heterogeneity. The first, habitat radiomics, treats a tumor not as a uniform mass but as a mosaic of spatially distinct subregions, or habitats, each with its own imaging signature. The team analyzed five MRI sequences: T1-weighted, T2-FLAIR, diffusion-weighted imaging, apparent diffusion coefficient maps, and contrast-enhanced T1 imaging, all acquired at 3.0 Tesla. Two experienced radiologists independently delineated regions of interest covering enhancing, non-enhancing, and necrotic areas, with disputes settled by a radiologist of 20 years’ experience. Images were resampled to a uniform 1 mm isotropic resolution, and a 5-by-5-by-5 moving window was applied to compute local features such as entropy and energy, producing a 24-dimensional matrix per voxel that combined intensity values from all five sequences.
K-means clustering was then used to automatically partition each tumor into distinct habitats without the need for laborious manual subregion tracing. Testing cluster counts from 2 to 10 with the Calinski-Harabasz score, Silhouette score, and Davies-Bouldin index revealed that three clusters best captured the intrinsic structure of the data. From these three habitats, the researchers extracted 1,834 handcrafted radiomic features spanning shape, first-order statistics, and texture measures using the Pyradiomics framework. Redundant features were pruned through Pearson correlation analysis with a threshold of 0.9, ranked by univariable Cox regression, and finally distilled by LASSO-Cox regression with cross-validation to yield a compact habitat signature predictive of progression-free survival.
The second pillar, pathomics, extracts quantitative information from whole-slide images of tumor tissue, a field sometimes framed as a computational answer to the subjectivity of manual pathology reading. Pathology slides were digitized with a Hamamatsu NanoZoomer S360 scanner, regions of interest were annotated in QuPath by two pathologists with arbitration by a senior colleague of 18 years, and the slides were cut into more than 12 million tiles of 512-by-512 pixels at 20-fold magnification after blank background removal and color normalization. The team then applied weakly supervised multiple-instance learning, in which individual patches inherit the label of their patient, namely whether that patient recurred within one year. Three convolutional neural network architectures were compared, and DenseNet121 won with a slide-level test AUC of 0.682, beating ResNet101 at 0.639 and Inception V3 at 0.612, while also showing the strongest sensitivity of 0.771 and a negative predictive value of 0.882.
Rather than relying on raw network outputs alone, the researchers converted patch-level predictions, probability histograms, and TF-IDF-derived text-like frequency features into a radiomics-style pathological signature, which was filtered through the same Pearson, univariable Cox, and LASSO-Cox pipeline to yield five final pathological features. Gradient-weighted Class Activation Mapping was used to visualize which regions of each image patch drove the model’s decisions, offering a degree of interpretability that the authors argue is essential for clinical credibility. The third model in the ensemble was built purely from clinical variables, including age, sex, body mass index, tumor volume, grade, pathological type, and IDH mutation status, selected through the same statistical machinery.
When the four models were evaluated using the concordance index, the combined model integrating habitat radiomics, pathomics, and clinical data clearly led. In the training cohort of 52 patients it reached a C-index of 0.883, compared with 0.867 for habitat radiomics alone, 0.849 for pathomics alone, and 0.719 for clinical data alone. In the 20-patient test cohort, the combined model scored 0.840 against 0.825, 0.740, and 0.730 respectively. Time-dependent ROC analysis reinforced the picture: the combined model achieved an AUC of 0.965 in training and 0.927 in testing, the highest test AUC of any model, although the authors candidly note that a training-cohort AUC of 1.000 for the pathomics model reflects inflation from sparse cases at a particular follow-up time point rather than perfection.
Perhaps the most striking demonstration of the model’s power came from risk stratification. Using the combined model’s risk score, patients were divided into high-risk and low-risk groups whose median progression-free survivals were 9 months and 77 months respectively, a separation significant at p less than 0.0001. Importantly, the stratification held even within molecular subgroups defined by isocitrate dehydrogenase, or IDH, mutation status, one of the most prognostically important markers in glioma. Among IDH wild-type patients, high-risk individuals had a median progression-free survival of 10 months versus 30 months for the low-risk group, and among IDH-mutant patients the model similarly identified a high-risk subgroup with median progression-free survival of only 9 months. In other words, the model surfaced poor prognoses even inside a molecular category generally considered more favorable, suggesting it captures biology that standard molecular testing misses.
The clinical implications outlined by the team are concrete. Patients flagged as high risk could be considered for escalated radiotherapy doses and fields, earlier integration of tumor-treating fields or anti-angiogenic therapy, extended maintenance temozolomide, preoperative drug treatment to improve surgical conditions, and more frequent surveillance imaging to catch progression early. Conversely, low-risk patients might safely receive reduced radiotherapy doses to limit side effects and longer follow-up intervals to ease financial and logistical burdens. The authors frame the model as a “virtual biopsy” that bridges macroscopic imaging and microscopic tissue architecture, providing a quantitative foundation for shared physician-patient decision-making and for health systems seeking to concentrate intensive resources where they will matter most.
The study is not without limitations, which the authors address directly. It was a single-center, retrospective analysis of 72 patients, a modest sample shaped by strict inclusion criteria that excluded patients lacking pathological slides, complete MRI sequences, or adequate follow-up. The model did not incorporate functional imaging, genomics, or attention-based deep learning mechanisms, and it predicted progression-free survival rather than overall survival. The team calls for prospective, multicenter validation and multi-omics integration as the next steps. Even so, the demonstration that habitat-level imaging heterogeneity and deep-learned pathological patterns are complementary, rather than redundant, marks a meaningful advance for a disease where every month of accurate prognosis can change the course of treatment.
Cite Scienmag News
Nathaniel Bowman. (September 7, 2026). New Prediction Model Forecasts High-Grade Glioma Progression Using Radiomics and Pathomics. Scienmag. https://scienmag.com/new-prediction-model-forecasts-high-grade-glioma-progression-using-radiomics-and-pathomics/
Nathaniel Bowman. "New Prediction Model Forecasts High-Grade Glioma Progression Using Radiomics and Pathomics." Scienmag, 7 September 2026, https://scienmag.com/new-prediction-model-forecasts-high-grade-glioma-progression-using-radiomics-and-pathomics/. Accessed 7 September 2026.
Nathaniel Bowman. "New Prediction Model Forecasts High-Grade Glioma Progression Using Radiomics and Pathomics." Scienmag. September 7, 2026. https://scienmag.com/new-prediction-model-forecasts-high-grade-glioma-progression-using-radiomics-and-pathomics/


