


Americans are famously mobile, but a sweeping new analysis of two decades of census data shows that movement within the United States is far from random. Instead, it follows deeply etched geographic patterns that differ sharply across racial, ethnic, and nativity groups, and that have persisted even as overall mobility has declined to historic lows. The study, published in the Journal of Population Research, combines spatial statistics with individual-level modeling to paint one of the most detailed portraits yet of who moves, where they cluster, and how those two stories diverge.
Ernesto F. L. Amaral and Nereyda Y. Ortiz Osejo de Lemus of Texas A&M University analyzed American Community Survey data spanning 2005 to 2024, covering adults aged eighteen and older across the entire country. Their central question was deceptively simple: are the places where migration rates run high the same for everyone, and do the groups with the strongest regional concentrations also have the highest individual likelihood of moving? The answer, they found, is frequently no—a discrepancy with significant implications for how researchers and policymakers understand population redistribution in America.
The backdrop to the study is what demographers have called the Great American Migration Slowdown. Between 1968 and 2009, annual interstate migration rates fell from 3.6 percent to just 1.6 percent, and between 1982 and 2015, moves across state and county lines dropped by roughly half. The new analysis confirms this trajectory continued into recent years: overall migration rates bottomed out at 4.57 percent in 2012, recovered modestly through 2019, dipped during the COVID-19 pandemic, and settled back down to 4.58 percent by 2024. The decline is pronounced compared with other developed countries and is thought to reflect reduced responsiveness to regional economic differences, growing place attachment, and shifts in job mobility.
But the aggregate numbers conceal enormous variation. Hispanic, non-Hispanic African American, and non-Hispanic Native American populations consistently showed lower migration rates than non-Hispanic whites and non-Hispanic Asians throughout the two decades studied, with foreign-born Hispanics recording the lowest rates of any group. Foreign-born individuals of all backgrounds moved less often than their U.S.-born counterparts, reflecting differences in settlement histories, social networks, and access to information about destinations. When the researchers modeled individual migration odds statistically, controlling for age, education, income, marital status, children, homeownership, employment, and region of residence, these group differences persisted rather than disappearing.
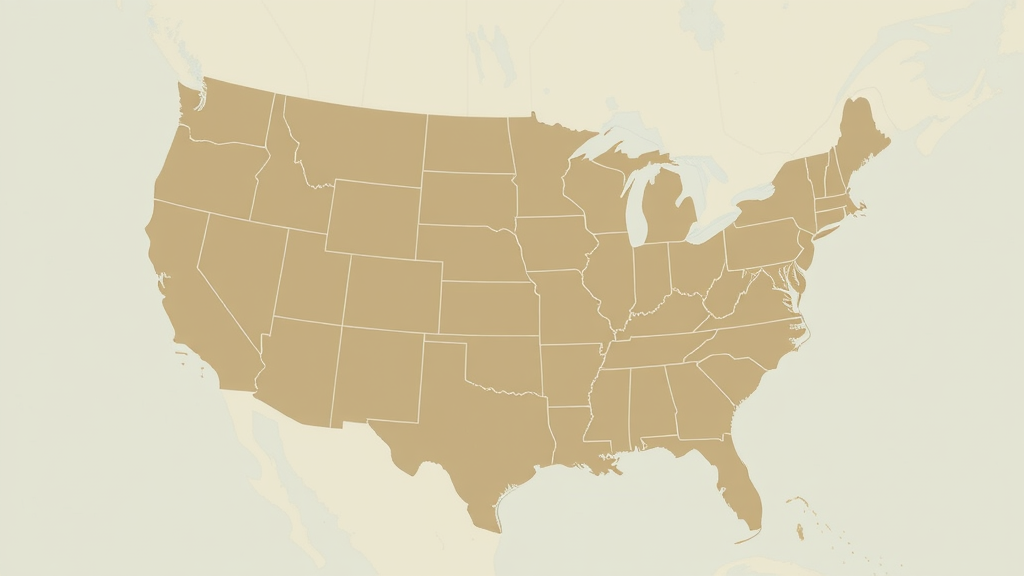
The spatial half of the analysis used a technique called Local Indicators of Spatial Association, or LISA, which identifies statistically significant clusters of high or low values across neighboring geographic areas. Applied to Migration Public Use Microdata Areas—the finest geography available in the public census microdata—the method revealed striking regional signatures. In 2019, hotspots of high internal migration appeared across parts of the West, including northern California, Nevada, Utah, southern Idaho, and northwestern Wyoming, along with central Texas and northern Florida. By 2024, most of the western hotspots had faded, while Texas and Florida concentrations endured. A long corridor of low migration, stretching from Texas through the Midwest to the Northeast, remained stable across the entire period and even expanded into California and New Mexico.
Those patterns, however, look very different depending on which demographic group is mapped. Non-Hispanic African Americans showed pronounced high-migration clusters across southeastern regions, alongside widespread low-migration zones in the Midwest, Northeast, and West. Hispanic clustering concentrated in California, the Mountain West, Texas, and Florida. Non-Hispanic Native Americans displayed high-migration clusters in the Northwest, Southwest, and parts of the Great Plains, including Arizona, Utah, New Mexico, Colorado, Oklahoma, and Alaska—areas where Indigenous populations are geographically concentrated. Non-Hispanic Asians, by contrast, were characterized mainly by low-migration clusters in southern and Midwestern regions, with some expansion into the Northwest by 2024.
Nativity proved to be a crucial modifier of these spatial patterns. U.S.-born Hispanics showed broad high-migration clustering across western and southern areas, while foreign-born Hispanics displayed far fewer hotspots, concentrated primarily in Texas and Florida by 2024. The contrast was equally stark for African Americans: U.S.-born Black migrants exhibited a broad southeastern pattern, whereas foreign-born Black migrants showed tightly localized clusters in eastern metropolitan areas, including Florida, Atlanta, and Washington, DC—patterns likely reflecting distinct immigrant origins, settlement networks, and labor market incorporation. Foreign-born whites, meanwhile, were marked predominantly by low-migration clusters across central regions of the country.
Perhaps the study’s most striking finding is that regional concentration and individual mobility are genuinely distinct dimensions of migration. Non-Hispanic African Americans and Hispanics both showed lower individual odds of moving than non-Hispanic whites after adjustment, yet both groups displayed strong, persistent regional hotspots. Conversely, non-Hispanic Asians showed relatively high individual mobility despite maps dominated by low-migration clusters. A group can be regionally concentrated precisely because most of its members who do move go to the same places, or because past settlement histories anchor its geography, without its members being frequent movers overall. The authors are careful to note that their LISA maps describe spatial clustering at selected points in time and cannot disentangle the cumulative flows, network effects, and historical settlement processes that may have produced them.
The research also has limitations that the authors acknowledge candidly. The analysis is associational rather than causal, and the logistic regression models do not formally account for spatial autocorrelation, which could lead to underestimated standard errors. The aggregated geographic units limit the ability to study very local dynamics, and detailed subgroup-specific flow analysis at the county level would require restricted Census data. The 2020 ACS, disrupted by pandemic data-collection problems, was tested in robustness checks and found not to alter the main results. Still, the authors argue the two-pronged approach—descriptive spatial clustering paired with adjusted individual-level models—offers a descriptive framework that previous single-lens studies could not provide.
What emerges is a compelling guide for future research. The findings point directly to places and populations where localized studies could uncover the mechanisms behind the patterns: Hispanic migration in Texas and Florida, African American migration in the Southeast, foreign-born African American settlement in Atlanta and Washington, DC, and Native American migration across the Southwest, Great Plains, and Alaska. The authors suggest combining administrative county-to-county flow data with survey microdata, and applying spatially explicit methods such as geographically weighted regression, to test whether the relationships they identify vary across places. As the United States continues to grow more demographically diverse while its residents grow more rooted, understanding precisely where and how different communities redistribute themselves—and why geography and mobility do not always move in tandem—has become an essential question for demographers, economists, and anyone concerned with regional inequality.
Subject of Research: Spatial patterns and demographic heterogeneity of internal migration in the United States by nativity and race/ethnicity
Article Title: Internal migration, demographic heterogeneity, and spatial patterns in the United States
Article References: Amaral, E. F. L., & Ortiz Osejo de Lemus, N. Y. (2026). Internal migration, demographic heterogeneity, and spatial patterns in the United States. Journal of Population Research, 43(3), Article 27. https://doi.org/10.1007/s12546-026-09434-0
Image Credits: AI Generated
DOI: 10.1007/s12546-026-09434-0
Keywords: internal migration, demographic heterogeneity, spatial clustering, LISA, nativity, race and ethnicity, American Community Survey, population redistribution, spatial demography, United States, logistic regression, migration slowdown
Cite Scienmag News
Courtney Benton. (September 12, 2026). New Maps Reveal Where Americans Move—and Who Stays Put. Scienmag. https://scienmag.com/new-maps-reveal-where-americans-move-and-who-stays-put/
Courtney Benton. "New Maps Reveal Where Americans Move—and Who Stays Put." Scienmag, 12 September 2026, https://scienmag.com/new-maps-reveal-where-americans-move-and-who-stays-put/. Accessed 18 October 2026.
Courtney Benton. "New Maps Reveal Where Americans Move—and Who Stays Put." Scienmag. September 12, 2026. https://scienmag.com/new-maps-reveal-where-americans-move-and-who-stays-put/


