


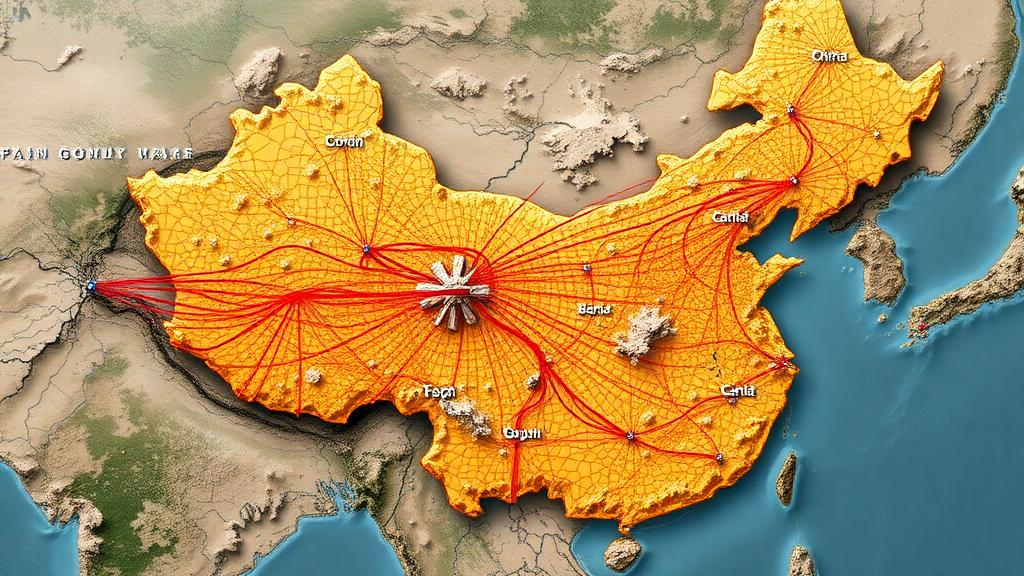
Climate change does not simply make places wetter or drier in place. It moves the lines on the map. In northern China, one of those lines carries enormous weight: the 400 millimeter annual precipitation isohyet, the long-contested boundary that separates the humid monsoon-fed east from the arid interior and has historically marked the edge between farming and pastoral land use. A new study published in Theoretical and Applied Climatology introduces a mathematical tool designed to measure exactly how the wandering of this boundary translates into concrete exposure for the people who live near it, and the results suggest that the direction in which a climate boundary moves matters as much as how far it moves.
The research, conducted by Zhang Xinrui and Yang Xueru of the College of Economics and Management at South China Agricultural University together with Wu Song of Changji University’s Key Laboratory of Financial Big Data, proposes what the authors call the Weighted Isohyet-shift Index, or WIS. Conventional precipitation indicators, such as total annual rainfall, standardized precipitation anomalies, or drought indices like the Standardized Precipitation Evapotranspiration Index, summarize conditions at a fixed point. They can tell you that a county received less rain this year than its long-term average, but they cannot tell you that the climatic zone to which that county belongs is physically migrating across the landscape. WIS was built to close that gap by converting the displacement of a climatic boundary into a county-level measure of exposure intensity.
The technical logic of the index is elegant in its construction. Rather than treating the 400 mm isohyet as a single line with one average position, the method identifies the boundary longitude by longitude. For each meridian crossing the study region, the researchers locate the longitude at which annual precipitation crosses the 400 mm threshold, then summarize the annual displacement of that crossing point as a weighted average across all longitudes. This produces a single number per year describing how far the boundary shifted, but the index does not stop there. It then combines the magnitude of the displacement with three additional ingredients: the direction of movement, the location of each county relative to the boundary, and a spatial distance-decay function that reduces the measured exposure as the distance between a county and the moving boundary grows.
That direction sensitivity is the conceptual heart of the work. A county lying just north of the 400 mm line experiences a northward shift of the boundary very differently from a county lying just south of it. When the humid envelope expands northward, land that was previously marginal for rain-fed agriculture is drawn into a wetter regime, potentially opening new cropping possibilities. When the humid envelope retreats southward, the same counties face the opposite prospect: encroaching aridity, increased pressure on water resources, and the risk that cultivated land slips back toward steppe conditions. A scalar measure of precipitation change would register both situations as simple rainfall fluctuations, but WIS assigns them distinct, signed exposure values that reflect which side of the boundary a county occupies and which way the boundary is heading.
To build the index, the team relied on a high-resolution 1-kilometer monthly precipitation dataset for China spanning more than a century, generated by Peng and colleagues and publicly archived at the National Tibetan Plateau Data Center. County-level agricultural and socio-economic variables, including crop planting areas, came from the China County Statistical Yearbook published by the National Bureau of Statistics, while administrative boundary vectors were obtained from the official Tianditu platform using the 2024 version of the national division dataset. The choice of the 400 mm isohyet is not arbitrary. In Chinese geography, this line approximates the farming-pastoral ecotone, a transition belt where ecosystems, livelihoods, and land-use systems are acutely sensitive to small changes in water availability, and where previous research has documented boundary shifts linked to climate change since the 1970s.
With the index in hand, the researchers turned to an empirical question: does exposure to a moving climate boundary show a measurable relationship with agricultural outcomes once ordinary meteorological and management factors are held constant? Using an estimation sample of counties constrained by the coverage of county-level agricultural statistics, they found that WIS remained statistically significant after controlling for conventional meteorological variables and agricultural management factors. In other words, the movement of the boundary itself carries information about agricultural response that is not already contained in how much rain fell or how it was farmed. This is a notable result, because it implies that the geography of climate change, the shifting arrangement of climatic zones across space, has consequences that point-based precipitation statistics systematically miss.
Perhaps the most striking finding is the asymmetry the index revealed. The agricultural responses associated with a northward expansion of the humid envelope were not mirror images of the responses associated with a southward retreat. Expansion and contraction of the wet zone produced different signatures in the data, an asymmetry that the authors note is difficult to identify using traditional precipitation-based measures. This makes physical and economic sense. Gaining access to a wetter regime may allow farmers to extend cultivation, adjust crop mixes, or intensify production, whereas losing that access may force abrupt adjustments, land abandonment, or a return to grazing, processes with different speeds, costs, and reversibilities. An index that can distinguish these two directions of change gives analysts a sharper instrument for detecting them in observational data.
The methodological pedigree of the approach draws on established traditions in spatial statistics and geographic information science. The distance-decay component reflects the well-understood principle that the influence of a spatial process diminishes with distance, while the longitude-by-longitude construction sidesteps some of the aggregation problems that geographers have long warned about, including the modifiable areal unit problem, in which results depend on the arbitrary spatial units used for analysis. By anchoring the index to a physically meaningful feature, the precipitation threshold itself, rather than to administrative borders, the authors tie exposure measurement to the climate system rather than to the cartography of governance. The framework is also portable in principle: any climatic boundary defined by a threshold, whether an isohyet, an isotherm, or a Koppen class edge, could in theory be tracked the same way.
The implications extend well beyond China. Analogous climatic divides exist around the world, from the arid-humid boundary near the 100th meridian in North America, whose past and future behavior has been the subject of extensive analysis, to the Sahel rainfall gradient in West Africa and the monsoon boundaries of South and East Asia. Global dryland expansion under warming has been documented repeatedly, and the Intergovernmental Panel on Climate Change’s Sixth Assessment Report emphasizes that precipitation patterns are being reorganized in spatially complex ways. An index that quantifies direction-sensitive exposure to moving climate boundaries offers planners a way to identify which communities sit in the path of an advancing or retreating zone, information that average-based climate projections do not readily provide. For ecological transition zones in particular, where thresholds and nonlinear responses are common, such spatially explicit exposure measures could sharpen climate risk assessment and guide agricultural adaptation planning.
The study also carries lessons about data and transparency. The authors make their data sources explicit and publicly traceable, from the meteorological archive to the statistical yearbooks and the official spatial boundary dataset, and they state that processed datasets generated during the analysis are available from the corresponding author upon reasonable request. Funded by the National Social Science Fund, the work reflects a growing trend of combining high-resolution environmental data with county-level socio-economic records to quantify how large-scale climate dynamics land on specific places and specific people. As climate boundaries continue to drift across the map in the decades ahead, tools like the Weighted Isohyet-shift Index may become essential for answering a deceptively simple question: not just how much the climate is changing, but who, precisely, is standing where the change arrives.
Subject of Research: A direction-sensitive exposure index quantifying how displacement of China's 400 mm precipitation isohyet affects county-level agriculture
Article Title: A weighted isohyet shift index linking climate boundary displacement and direction-sensitive geographic exposure
Article References: Xinrui, Z., Xueru, Y., & Song, W. (2026). A weighted isohyet shift index linking climate boundary displacement and direction-sensitive geographic exposure. Theoretical and Applied Climatology, 157(10), Article 614. https://doi.org/10.1007/s00704-026-06557-5
Image Credits: AI Generated
DOI: 10.1007/s00704-026-06557-5
Keywords: climate change, isohyet, precipitation boundary, geographic exposure, agriculture, drylands, farming-pastoral ecotone, spatial analysis, climate risk, adaptation planning, China, drought index
Cite Scienmag News
Violet Maxwell. (October 8, 2026). New Index Tracks How Shifting Rain Boundaries Expose China’s Counties. Scienmag. https://scienmag.com/new-index-tracks-how-shifting-rain-boundaries-expose-chinas-counties/
Violet Maxwell. "New Index Tracks How Shifting Rain Boundaries Expose China’s Counties." Scienmag, 8 October 2026, https://scienmag.com/new-index-tracks-how-shifting-rain-boundaries-expose-chinas-counties/. Accessed 8 October 2026.
Violet Maxwell. "New Index Tracks How Shifting Rain Boundaries Expose China’s Counties." Scienmag. October 8, 2026. https://scienmag.com/new-index-tracks-how-shifting-rain-boundaries-expose-chinas-counties/


