


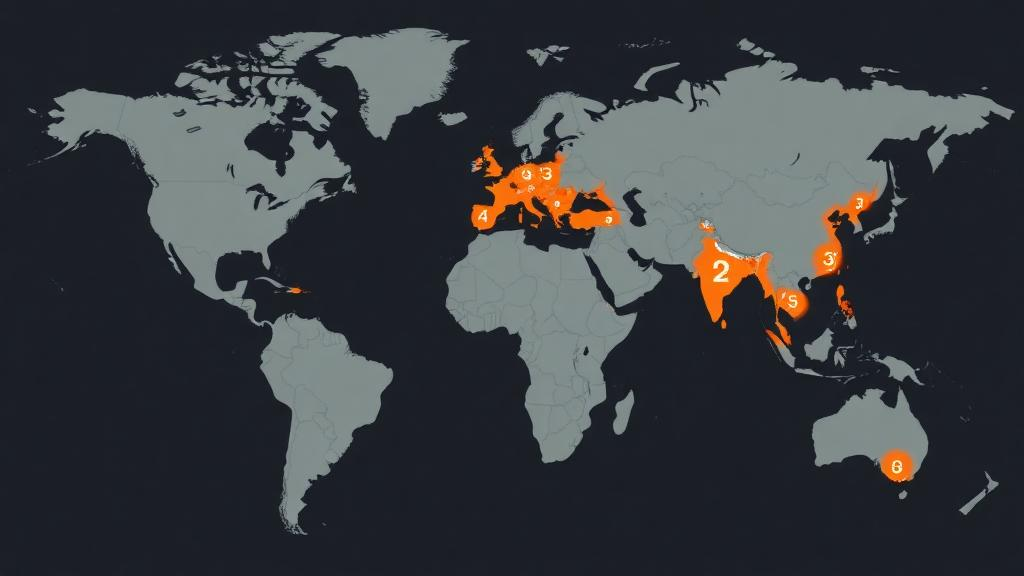
A decade of global disaster records has been distilled into a new map of where the world’s deadliest catastrophes are clustering, and the answer is strikingly concentrated. Researchers at Tongji University in Shanghai have developed a metric called the Accumulated-Event Risk Indicator, or ARI, which sifts through the Emergency Events Database (EM-DAT) for the period 2013 to 2023 and reveals that recent major disasters are far from randomly distributed across the planet. Instead, they pile up in a narrow band of territory running through South and Southeast Asia and along the Himalayan belt, where floods, storms, earthquakes and landslides have repeatedly struck some of the most vulnerable populations on Earth. The study, published in the journal Natural Hazards and Earth System Sciences, identifies 153 grid cells worldwide with non-zero risk accumulation and singles out 14 principal hotspots that together span areas of ten countries: India, China, Pakistan, the Philippines, Nepal, Bhutan, Indonesia, Myanmar, Bangladesh and Mexico.
The methodology behind the indicator is deliberately simple but technically pointed. The authors divided the globe into 5-degree by 5-degree latitude–longitude cells and, for each cell, summed the country-level World Risk Index (WRI) values attached to every qualifying disaster event. To qualify, an event had to have caused at least 50 reported fatalities, a screening threshold the researchers chose because mortality data are more consistently reported across countries than other EM-DAT variables. Indicators such as the number of people affected or the economic damage of a disaster vary widely in how nations define and estimate them, making cross-country comparison unreliable. Deaths, grim as the metric is, travel better across borders. Applying the threshold to EM-DAT’s 3,217 target events from the study period yielded 344 major disasters: floods dominated the sample at 58.1 percent of events, followed by storms at 22.7 percent, earthquakes at 9.9 percent and mass movements at 9.3 percent.
One of the study’s central technical challenges was spatial standardization. EM-DAT records many events only through textual descriptions of affected places, such as city and village names, and only earthquakes come with precise coordinates for every entry. Floods and storms can sweep across broad, discontinuous areas, complicating any attempt at grid-based aggregation. The researchers therefore applied a rule-guided manual procedure that converts each event into a single representative location anchor, constrained by the geography documented in the original record. When an event spanned multiple administrative units, one anchor was assigned to a single grid cell to avoid double-counting. The authors acknowledge that this point-based approach compresses the spatial footprints of geographically extensive hazards, and they tested its influence directly using the 2022 Pakistan floods, whose EM-DAT description supports locations across nine grid cells.
The choice of the World Risk Index as the contextual weight is central to the design. Published annually since 2011, the WRI expresses risk as the geometric mean of exposure and vulnerability, combining population exposed to hazards with measures of susceptibility, lack of coping capacities and lack of adaptive capacities. By multiplying recent event recurrence with this structural risk context, ARI captures something neither component reveals alone. In diagnostic comparisons across the 153 non-zero cells, ARI correlated moderately with an equivalent grid-level WRI (Spearman rank correlation of 0.698) and with an unweighted count of major events (0.697), but the overlap among the top-priority sets was far lower, with Jaccard similarities as low as 0.148 against the WRI-only reference. In other words, layering a decade of actual catastrophic events onto structural vulnerability reorganizes the upper tier of global priorities in a way that neither index achieves on its own.
The resulting hotspot geography is dominated by Asia. High ARI values concentrate around the Himalayas and along the coastal belts of South and Southeast Asia, where repeated major floods, tropical cyclones and earthquakes have accumulated within a single decade. Many of these clusters extend across national borders, reflecting the transboundary nature of riverine floods and cyclones. The study’s regional zoom-in illustrates the added value of the grid approach: in areas spanning multiple countries, the country-level WRI alone mainly reflects national background differences, while ARI differentiates neighbouring cells according to where events actually accumulated. Within large countries such as China, where the WRI is spatially uniform by construction, ARI still reveals marked subnational heterogeneity, pinpointing internal hotspots that national indices cannot see.
Perhaps the most compelling validation is temporal. The researchers deliberately excluded 2024 and 2025 from the indicator’s construction and then asked where major Asian disasters recorded in those two years actually occurred. Of 44 qualifying events, 24, or 57.1 percent, fell within the predefined global Top-14 ARI cells, compared with only 23.8 percent for the WRI-only reference. Under a strict equal-grid benchmark in an Asia-specific universe of 76 cells, the tie-inclusive Top-10 ARI set contained 22 of the 44 later events, an observed-to-expected ratio of 3.80 at the event level. The concentration was strongest in the most selective upper tail: the Top-5 ARI set captured later events at 5.53 times the equal-grid expectation, the highest ratio among all indicators tested. Unweighted event count became increasingly competitive as the retained set broadened, suggesting that the WRI weighting matters most when only a handful of regions can be prioritized.
Sensitivity analyses reinforce the robustness of the broad pattern. Varying the fatality threshold to 40, 60 or 70 deaths changed the number of non-zero cells, but 12 or 13 of the 14 baseline hotspots remained in the alternative Top-14 sets, with Spearman correlations to the baseline ordering between 0.880 and 0.907. Refining the grid from 5 degrees to 2.5 degrees increased non-zero cells from 153 to 218, yet 85.7 percent of the baseline hotspot cells contained at least one high-ARI finer-resolution child, indicating that refinement localizes the strongest signal within the broader hotspots rather than dissolving them. The Pakistan flood experiment showed that redistributing the event’s full WRI contribution of 26.45 equally across nine supported cells shifted individual ranks slightly but left the global Top-5, Top-10, Top-14 and Top-20 sets unchanged.
Beyond the mapping exercise, the study delivers a substantial practical resource: the 3H Dataset, a compilation of standardized high-resolution remote-sensing imagery assembled for the 14 hotspot grids. High-resolution, sub-metre visible-spectrum imagery is costly and unevenly available, particularly in developing countries where open-data coverage tends to focus on large cities or specific crisis events. Drawing primarily on the RAMP Building Footprint Training Dataset and the DigitalGlobe/Maxar Open Data Program, and acquiring supplementary imagery for two data-scarce grids, the researchers compiled 7,583,094 standardized TIF image tiles of 256 by 256 pixels each, with spatial resolutions ranging from 0.27 to 0.54 metres. All scenes were quality-screened, tiled and annotated with hotspot-grid identifiers, creating a traceable resource for building damage detection, exposure mapping and post-disaster recovery monitoring.
The authors are candid about the framework’s limits. Mortality-based screening emphasizes sudden-onset, high-fatality disasters and underrepresents events dominated by economic losses, cascading impacts or slow-onset processes such as drought. The single-anchor allocation simplifies the footprints of extensive hazards, and country-level WRI values cannot capture within-country variation or rapidly changing local conditions. ARI is also a static, retrospective measure that treats all events in the decade equally, regardless of recency. The researchers point to three directions for future work: temporally weighted formulations that account for event recency and recovery periods, footprint-aware allocation and multidimensional severity measures, and integration of projected hazard changes and socio-economic scenarios to link retrospective accumulation with forward-looking assessment.
Even with those caveats, the study offers policymakers, humanitarian organizations and researchers something existing global indices do not: a transparent, grid-based picture of where catastrophic events have actually piled up most heavily in the recent past, validated against where they continued to strike afterward. As climate change intensifies hazards and populations in vulnerable regions keep growing, tools that can narrow a planet of potential disaster zones down to a defensible shortlist of priority areas are likely to become increasingly valuable. The 14 hotspots identified here, stretching from the Ganges basin to the Philippine archipelago, now come equipped not only with a quantitative rationale for their selection but with the high-resolution imagery needed to study them street by street.
Subject of Research: Global multi-hazard disaster risk assessment using the Emergency Events Database and the World Risk Index
Article Title: Global disaster risk assessment from Emergency Events Database (2013–2023)
Article References: Kong, Q., & Zhu, E. (2026). Global disaster risk assessment from Emergency Events Database (2013–2023). Natural Hazards and Earth System Sciences, 26(10), 4881-4910. https://doi.org/10.5194/nhess-26-4881-2026
Image Credits: AI Generated
DOI: 10.5194/nhess-26-4881-2026
Keywords: disaster risk, EM-DAT, World Risk Index, hotspots, floods, earthquakes, remote sensing, Himalaya, Southeast Asia, vulnerability, multi-hazard, 3H Dataset
Cite Scienmag News
Violet Maxwell. (October 8, 2026). New Global Disaster Map Pinpoints 14 Hotspots Where Catastrophes Keep Striking. Scienmag. https://scienmag.com/new-global-disaster-map-pinpoints-14-hotspots-where-catastrophes-keep-striking/
Violet Maxwell. "New Global Disaster Map Pinpoints 14 Hotspots Where Catastrophes Keep Striking." Scienmag, 8 October 2026, https://scienmag.com/new-global-disaster-map-pinpoints-14-hotspots-where-catastrophes-keep-striking/. Accessed 8 October 2026.
Violet Maxwell. "New Global Disaster Map Pinpoints 14 Hotspots Where Catastrophes Keep Striking." Scienmag. October 8, 2026. https://scienmag.com/new-global-disaster-map-pinpoints-14-hotspots-where-catastrophes-keep-striking/


