Sound travels through the ocean along paths set by temperature, salinity and pressure, and those paths are shifting as the ocean warms. A research team led by scientists at the National Institute of Oceanography and Applied Geophysics—OGS in Trieste, Italy, has now built a new global dataset that tracks sound speed across the world’s oceans at monthly intervals over three decades, from 1993 to 2022. The dataset, described in Frontiers in Ocean Sustainability, is derived from the Copernicus Marine GLORYS12V1 ocean reanalysis and offers a resolution and temporal reach that the authors say substantially exceed previous global products.
The dataset provides monthly sound speed fields at a horizontal resolution of 1/12 of a degree, spanning 50 vertical levels, together with associated uncertainty estimates. Compared with earlier global sound speed products, it extends temporal coverage to 30 years and improves both spatial and temporal resolution, enabling analyses of seasonal, interannual and climate-driven variability in ocean acoustic properties. The work was carried out by Alice Affatati, Chiara Scaini and Stefano Salon of OGS, together with Tuan Dat Nguyen, Muhammad Arabi Tayyab and Sandro Fiore of the University of Trento.
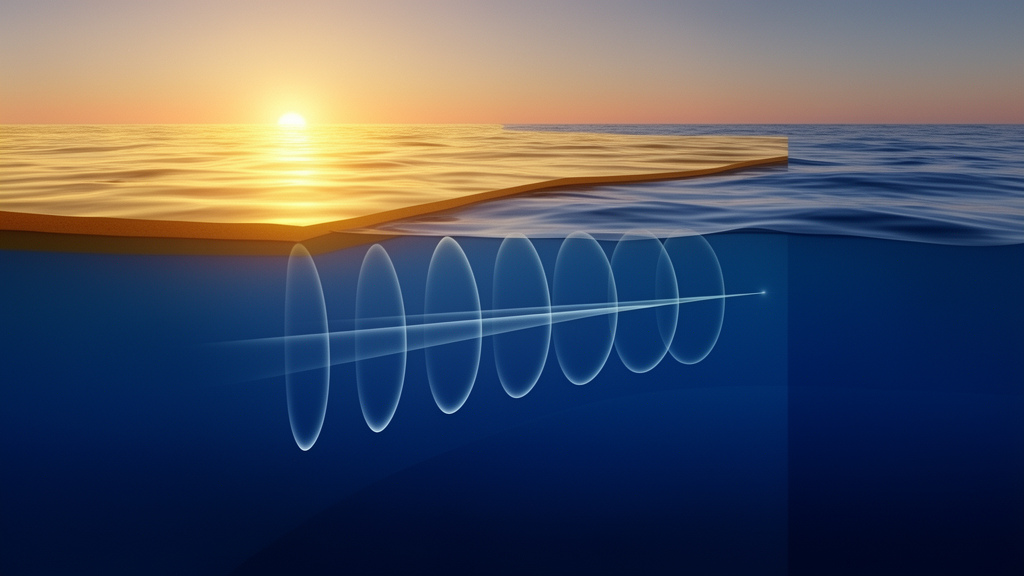
Sound speed is a crucial parameter for underwater sound propagation. Marine fauna rely on acoustic cues for communication, navigation, foraging and mating, while human sources such as shipping, seismic surveys, sonar and pile driving increasingly alter marine soundscapes and can mask animal signals. Changes in ocean temperature and stratification modify sound speed and therefore how sound propagates. The vertical sound-speed structure also determines the position and character of the deep sound channel, known as the SOFAR channel, where sound can travel efficiently over long distances. Climate-driven changes in the depth of the sound-speed minimum may modify the geometry and efficiency of this waveguide, with potential consequences for the propagation range of biologically important sounds.
To compute sound speed, the team used the Mackenzie (1981) equation, which relates sound speed to temperature, salinity and depth with an accuracy of about 0.1 meters per second. The researchers selected this formulation for its computational efficiency when processing a global, high-resolution, multi-decadal dataset. Although more recent formulations such as Leroy et al. (2008), TEOS-10 and Del Grosso (1974) provide slightly higher accuracy, the authors note that differences under typical oceanic conditions are generally small—roughly 0.1 to 0.3 meters per second—and comparable to or smaller than the uncertainty associated with the underlying reanalysis temperature and salinity fields. Input temperature and salinity fields came from GLORYS12V1, an eddy-resolving ocean reanalysis that integrates numerical ocean modeling with the assimilation of in situ and remote-sensing observations. Uncertainty in the sound speed was estimated by propagating the global root-mean-square differences of the input temperature and salinity fields, as documented in the reanalysis quality information.
The scale of the computation required substantial resources. All data collection, numerical computation, analysis and visualization were performed on the high-performance computing cluster at the University of Trento, with data handled using the Xarray library and the processing tasks parallelized with the Dask framework. The result is a set of 30 yearly NetCDF files, each containing monthly mean sound speed and uncertainty fields at every grid point and vertical level.
At the global scale, the computed sound speed ranges from about 1,425.2 to 1,545.5 meters per second at a level near 50 meters depth and from about 1,448.47 to 1,540.7 meters per second near 500 meters. Values increase overall from polar areas toward the equator, roughly following the global temperature field, since sound speed depends linearly on temperature at first order. At the shallow level, the highest values, around 1,550 meters per second, occur in southeast Asia, the Philippine Sea and the western and middle Pacific Ocean. At the deeper level, maxima appear in the northern Atlantic Ocean, particularly the Sargasso Sea, and the Mediterranean Sea. The annual standard deviation, an indicator of the seasonal cycle range, reaches values on the order of 10 to 20 meters per second at 50 meters depth along the northeast Atlantic coast, the south Atlantic offshore Argentina, the Sea of Japan and the eastern central Pacific offshore Central America. At the deeper level, maximum standard deviations range from 4 to 12 meters per second in similar areas, such as the Gulf Stream region and the Sea of Japan. Uncertainty is on the order of 5 meters per second at most, larger at shallow levels and roughly increasing with latitude, always below 3 meters per second at deeper levels, and highest in polar areas.
The team illustrated the dataset at two locations previously identified as acoustic hotspots, where sound-speed variations are expected to exceed approximately 1.5 percent under future climate conditions: the northwestern Atlantic Ocean near the Newfoundland shelf and the Greenland Sea. Near the surface, the 30-year annual mean sound speed is approximately 1,470 meters per second at Greenland and 1,494 meters per second at Newfoundland. At both locations, sound speed generally decreases from the surface through the upper and intermediate ocean, reaches a minimum at intermediate depths, and then increases progressively toward the deep ocean. The seasonal cycle is strongest near the surface, with sound speed increasing during summer and decreasing during late winter and early spring, and this seasonal variability weakens substantially with depth. Variability is greatest near the surface, with annual standard deviations of approximately 1.8 meters per second at Greenland and 1.7 meters per second at Newfoundland, and monthly variability during warmer months reaching more than 2 meters per second at Greenland and approximately 3 meters per second or more at Newfoundland, falling below about 1 meter per second at intermediate and deep levels.
The estimated long-term trends are predominantly positive, particularly in the upper ocean. At Greenland, the trend is positive throughout the available depths, reaching approximately 0.14 meters per second per year near the surface and decreasing to approximately 0.02 to 0.03 meters per second per year at depth. Newfoundland shows weaker and more vertically heterogeneous trends, with values of approximately 0.03 to 0.06 meters per second per year across much of the upper 500 to 2,000 meters, while trends approach zero or become slightly negative at some deep levels. The authors are careful about how these figures should be read: they state that the trends should be interpreted as estimated long-term changes rather than statistically significant climate trends, and they recommend that future work evaluate trend significance and changes in derived indicators such as the depth of the sound-speed minimum, SOFAR-channel width and critical depth.
Compared with an earlier global sound speed dataset covering 2006 to 2016, the new product offers wider temporal coverage (30 versus 10 years) and higher spatial (1/12 degree versus 1/4 degree) and temporal (monthly versus yearly) resolution. In a cell-by-cell comparison after resampling both datasets to 1-degree resolution, the maximum positive difference at the level near 50 meters was approximately 15.3 meters per second, or 1.0 percent, in the Greenland and Barents seas, while the maximum negative difference was 18.8 meters per second, or 1.23 percent, in the eastern tropical Pacific off Central America. At the level near 454 meters, the maximum positive difference was 17.6 meters per second, or 1.15 percent, and the maximum negative difference was 11.3 meters per second, or 0.74 percent, near the eastern Ross Sea. The authors attribute the higher variability associated with GLORYS12V1 to its finer resolution and more realistic representation of oceanographic fields, and note that the higher root-mean-square differences of the input temperature and salinity fields reflect the introduction of Argo observations and enhanced data assimilation.
The dataset comes with important caveats. Because the record covers 1993 to 2022, changes in the observing system should be considered when interpreting long-term variability: the assimilation of Argo profiling floats into GLORYS12V1 from 2004 substantially improved the representation of subsurface temperature and salinity, so analyses restricted to 2005 to 2022 benefit from a more homogeneous observational constraint, while analyses covering the full record should account for the potential influence of observing-system changes. The uncertainty estimates also rely on globally constant root-mean-square values for broad depth intervals, and the authors suggest that future improvements could account for their spatial variability. Even so, the dataset and its processing workflow are openly available, and the authors present it as a foundation for numerical sound propagation modeling, climate impact assessments, investigations of changing marine acoustic habitats, and ecosystem-based marine management and conservation planning under a changing climate.
Subject of Research: A global multi-decadal dataset of ocean sound speed derived from the GLORYS12V1 ocean reanalysis
Article Title: Unraveling ocean sound speed through a high-resolution multi-decadal dataset at the global scale
Article References: Affatati, A., Scaini, C., Nguyen, T. D., Tayyab, M. A., Fiore, S., & Salon, S. (2026). Unraveling ocean sound speed through a high-resolution multi-decadal dataset at the global scale. Frontiers in Ocean Sustainability, 4, Article 1961689. https://doi.org/10.3389/focsu.2026.1961689
Image Credits: AI Generated
DOI: 10.3389/focsu.2026.1961689
Keywords: ocean acoustics, sound speed, GLORYS12V1, ocean reanalysis, SOFAR channel, acoustic habitat, climate change, Copernicus Marine, underwater noise, marine soundscapes, high-performance computing, ocean warming
Cite Scienmag News
Violet Maxwell. (October 28, 2026). New 30-Year Global Sound Speed Dataset Maps How a Warming Ocean Carries Sound. Scienmag. https://scienmag.com/new-30-year-global-sound-speed-dataset-maps-how-a-warming-ocean-carries-sound/
Violet Maxwell. "New 30-Year Global Sound Speed Dataset Maps How a Warming Ocean Carries Sound." Scienmag, 28 October 2026, https://scienmag.com/new-30-year-global-sound-speed-dataset-maps-how-a-warming-ocean-carries-sound/. Accessed 28 October 2026.
Violet Maxwell. "New 30-Year Global Sound Speed Dataset Maps How a Warming Ocean Carries Sound." Scienmag. October 28, 2026. https://scienmag.com/new-30-year-global-sound-speed-dataset-maps-how-a-warming-ocean-carries-sound/