


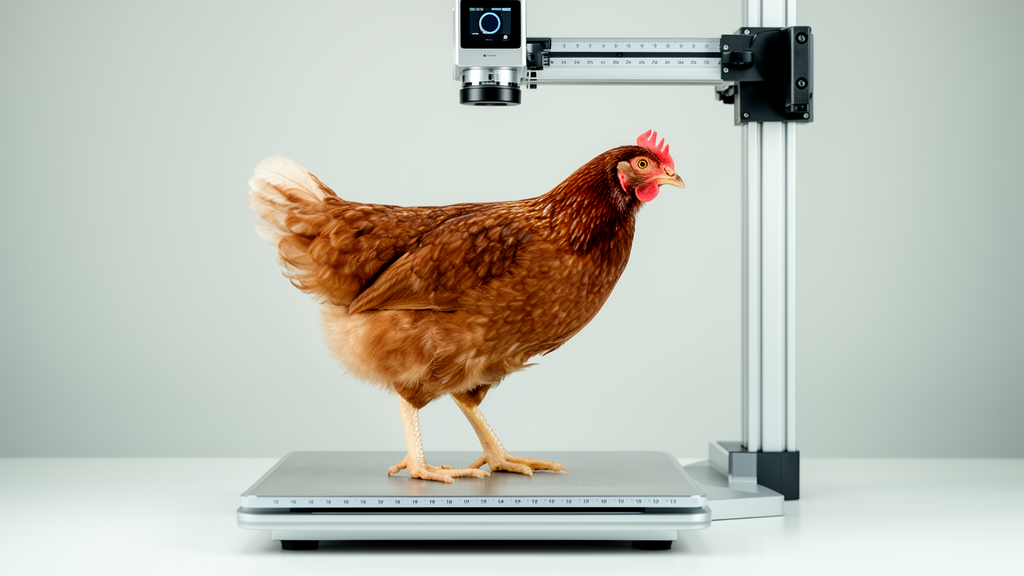
A multimodal SegFormer imaging system measured shank length in live chickens through anatomical masks and explicit geometric anchors, producing highly consistent repeated measurements while keeping every endpoint visually traceable. On an independent test set of 10 chickens, the fused visible-light and infrared approach recorded a mean absolute deviation of 0.2894 mm, a mean standard deviation of 0.3663 mm and a mean coefficient of variation of 0.50% across repeated captures. Its measurements were positively correlated with manual vernier-caliper references, but the automated and manual values differed substantially on the absolute scale and could not be used interchangeably without calibration.
The experiment involved 100 Yellow and Spotted-brown chickens at Fuhe Chicken Farm in Guangzhou, Guangdong Province, China. The population included 70 Spotted-brown chickens aged 163 days, 15 Spotted-brown chickens aged 144 days and 15 Yellow chickens aged 183 days. Each bird underwent 10 non-consecutive captures, with every visible-light frame acquired synchronously with an infrared frame. The collection yielded 1,000 images per modality and 1,000 spatially registered, fused images. The researchers partitioned the birds, rather than their images, at an 8:1:1 ratio into training, validation and independent test sets, ensuring that all repeated views of a given chicken remained in the same subset. Two operators measured shank length manually with vernier calipers, and their average served as the individual reference used for correlation and agreement analyses.
The imaging platform combined a HIK MV-CE060–10UC visible-light industrial camera, operating at 3,072 by 2,048 pixels and 42.7 frames per second, with an IRay AT-61 uncooled vanadium-oxide infrared camera operating at 640 by 512 pixels and 25 frames per second. The optical distance from the camera center to the chicken’s suspended measurement plane was fixed at 380 mm. Two custom light arrays illuminated the scene, and a heated double-layer stainless-steel calibration plate with a 20 mm center-to-center spacing provided a stable geometric reference. Corresponding circular patterns in the calibration plate established control points for registering the infrared images to the visible-light coordinate system. A Haar-wavelet fusion procedure then combined visible high-frequency texture with infrared low-frequency thermal information. The resulting conversion factors were 0.1770 mm per pixel for visible and fused images and 0.3509 mm per pixel for the original infrared images.
The central technical change was the replacement of direct scalar regression with pixel-level anatomical segmentation. SegFormer-B1 used a Mix Transformer B1 encoder and a lightweight all-multilayer-perceptron decoder to classify each image pixel as background, an upper bare metatarsal-toe region or a lower feathered thigh-shank region. The models were trained for 6,400 iterations with AdamW on 640-by-640-pixel crops and a batch size of 24. Masked cross-entropy loss excluded invalid zero-padded pixels. Images were normalized, randomly resized over scales from 0.5 to 2.0, cropped and augmented with horizontal flipping and photometric distortion; the study reported their use but did not separately measure whether any particular augmentation improved performance. Because the segmentation masks and both endpoint locations remained available as intermediate outputs, an unusual measurement could be traced to semantic segmentation or upper- and lower-anchor localization rather than to an unexplained scalar output.
On the independent test set, fused images produced the strongest overall segmentation performance, with a mean intersection over union of 93.92%, overall accuracy of 99.54% and mean pixel accuracy of 96.62%. Visible images achieved corresponding values of 88.62%, 99.20% and 92.41%, while infrared images reached 92.79%, 99.45% and 95.61%. The largest difference among modalities occurred in the lower feathered region, where intersection over union was 87.61% for fused images, 85.36% for infrared and 75.51% for visible light. For the upper bare region, the values were 94.61%, 93.59% and 91.13%, respectively. The authors associated the fused result with complementary image information: visible texture helped constrain anatomical boundaries, while infrared contours helped compensate for contour loss caused by shadows and feather occlusion.
The two measurement anchors were localized with different rules because the two anatomical regions responded differently to inverted suspension and articulated movement. The upper key point was the global geometric centroid of the complete bare metatarsal-toe mask. Using all valid pixels in that region acted as a two-dimensional low-pass operation, reducing sensitivity to abrupt boundary changes caused by toes opening, closing or adopting different configurations. The lower key point was identified at the interface between the feathered and bare regions. A morphological difference operation extracted a single-pixel boundary from the feathered-region mask, and a distance transform measured each boundary pixel’s shortest geometric distance to the bare region. A two-pixel contact threshold isolated the interface set, whose vertical extreme became the lower anchor. At the calibrated plane, that threshold represented 0.3540 mm in the visible and fused modalities and 0.7018 mm in infrared images. The Euclidean distance between the two anchors was then converted from pixels to millimetres.
Ablation experiments indicated that both spatial constraints contributed to repeated-measurement stability. Replacing the global centroid with skeleton-junction localization increased the fused modality’s mean absolute deviation from 0.2894 to 1.2186 mm, its mean standard deviation from 0.3663 to 1.6641 mm and its mean range ratio from 1.54% to 6.45%. Its Pearson correlation with manual measurements also fell from 0.7109 to 0.6782. Visual comparisons showed that local changes in toe topology could shift a skeleton junction between captures, while the centroid remained near the center of the predicted upper region. Replacing the distance-transform interface with medial-axis peak localization produced a fused mean absolute deviation of 2.0929 mm, a mean standard deviation of 2.6454 mm and a mean range ratio of 12.81%. That alternative had a slightly higher Pearson correlation of 0.7458, but its anchor varied more across repeated images as feather coverage and regional geometry changed.
Visible images had the strongest association with the manual reference, with Pearson’s r of 0.7696 and p = 0.0092. Infrared images produced r = 0.7150 and p = 0.0201, while fused images produced r = 0.7109 and p = 0.0212. All three modalities therefore showed significant positive correlations at the individual level. The fused modality nevertheless delivered the most consistent measurements, with the lowest mean and median absolute deviations, standard deviations, coefficients of variation and range ratios. Its median absolute deviation was 0.2585 mm, its median standard deviation was 0.3354 mm, its median coefficient of variation was 0.44% and its median range ratio was 1.29%. The results support an increasing association between the visual and manual measurements and show that fusion reduced acquisition-to-acquisition fluctuation; they do not establish that the methods reproduced the complete ordering of individual birds’ shank lengths.
Repeated-measures Bland–Altman analysis established a clear boundary on the result. The fused system produced values lower than manual caliper measurements by a mean of 13.0411 mm, with 95% limits of agreement from 2.4178 to 23.6643 mm. The visible and infrared mean biases were 14.3377 and 20.0588 mm, respectively, with limits of agreement of 4.6586–24.0168 mm and 9.5217–30.5958 mm. Differing endpoint definitions were presented as a possible main explanation for the systematic difference: operators selected caliper contact points, sometimes after parting or compressing feathers, whereas the algorithm used the centroid of the bare upper region and the interface between two segmented regions. Regression found no significant proportional bias, and Spearman analysis found no significant heteroscedasticity within the tested range. The wide agreement intervals nevertheless showed that the amount of underestimation was not constant among chickens.
The study has important limitations. The independent test set contained only 10 birds and was unevenly distributed across two breeds and three ages. Ten repeated observations per chicken increased the amount of within-animal information but did not increase the number of statistically independent individuals, limiting the precision of the Bland–Altman estimates and the statistical power of the proportional-bias and heteroscedasticity tests. The design also could not separate the effects of breed, age and individual morphology on the wide limits of agreement. All birds were measured in a controlled suspended setup, leaving performance during free movement, under different handling conditions and in uncontrolled farming environments unknown. Larger, balanced and independently validated populations will be needed to establish whether the visual and caliper scales remain stable across broader chicken groups. Until then, the system is best regarded as a consistent contactless visual reference for phenotypic comparison, rather than an uncalibrated numerical replacement for manual caliper measurement.
Subject of Research: Contactless measurement of live-chicken shank length using multimodal semantic segmentation and geometric endpoint localization
Article Title: Multimodal semantic segmentation measurement of shank length in live chickens based on SegFormer and geometric positioning strategy
Article References: Zheng, H., Lin, Z., Ma, C., Lin, P., Liang, Z., Bi, W., Guo, Y., Jiang, T., Yuan, K., Ma, L., & Ding, H. (2026). Multimodal semantic segmentation measurement of shank length in live chickens based on SegFormer and geometric positioning strategy. Smart Agricultural Technology, 15, Article 102641. https://doi.org/10.1016/j.atech.2026.102641
Image Credits: AI Generated
DOI: 10.1016/j.atech.2026.102641
Keywords: live chicken phenotyping, shank length, SegFormer-B1, semantic segmentation, infrared imaging, multimodal fusion, geometric localization, distance transform, computer vision, Multimodal, semantic, segmentation
Cite Scienmag News
William Thompson. (October 20, 2026). Multimodal semantic segmentation measurement of shank length in live chickens based on SegFormer and geometric positioning strategy. Scienmag. https://scienmag.com/multimodal-semantic-segmentation-measurement-of-shank-length-in-live-chickens-based-on-segformer-and-geometric-positioning-strategy/
William Thompson. "Multimodal semantic segmentation measurement of shank length in live chickens based on SegFormer and geometric positioning strategy." Scienmag, 20 October 2026, https://scienmag.com/multimodal-semantic-segmentation-measurement-of-shank-length-in-live-chickens-based-on-segformer-and-geometric-positioning-strategy/. Accessed 20 October 2026.
William Thompson. "Multimodal semantic segmentation measurement of shank length in live chickens based on SegFormer and geometric positioning strategy." Scienmag. October 20, 2026. https://scienmag.com/multimodal-semantic-segmentation-measurement-of-shank-length-in-live-chickens-based-on-segformer-and-geometric-positioning-strategy/


