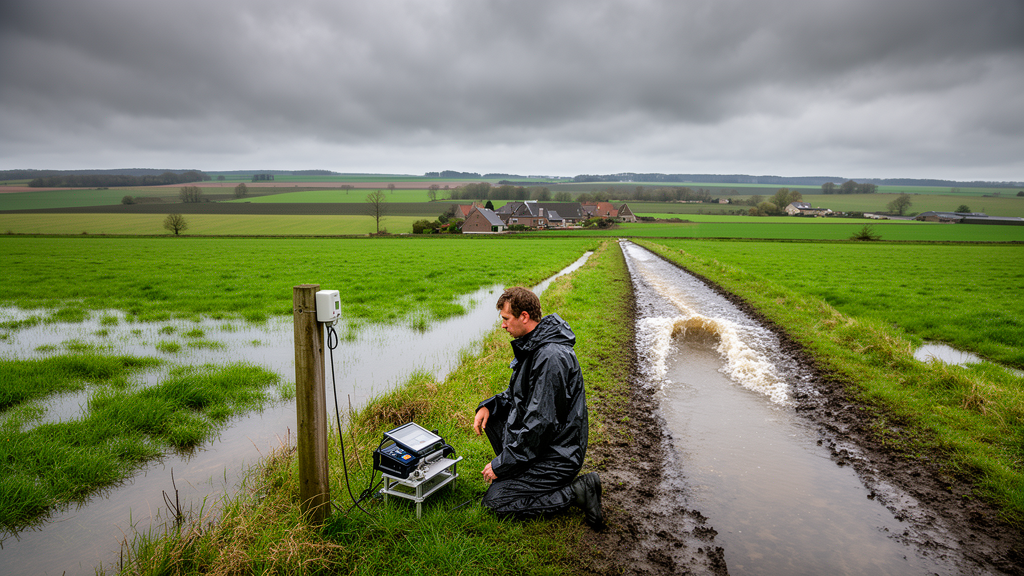
A new study published in Hydrology and Earth System Sciences tackles this blind spot by building and testing a high-resolution computer model that traces how rainfall becomes damaging surface runoff across farmland, using a well-monitored experimental catchment in central Belgium as its proving ground. The work, led by Matthieu Herpoel of Gembloux Agro-Bio Tech, University of Liège, offers a template for predicting pluvial flooding in the countless ungauged basins where such hazards strike first.
The stakes are considerable. Pluvial flooding, which occurs when intense rainfall generates excessive surface runoff and rapid, localized water accumulation, differs fundamentally from traditional riverine flooding. In England alone, roughly one million properties are at high risk of surface water flooding, triple the number exposed to riverine and coastal hazards. The devastating July 2021 floods in Western Europe showed how extreme these events can become: within just three days, parts of the Belgian Vesdre basin received up to 290 millimeters of rain, nearly one-fifth of the regional annual average. Small agricultural catchments, where gauge data are typically absent, remain especially hard to predict.
The study area is a headwater catchment at Chastre in the Belgian loess belt, a region historically prone to water erosion and muddy floods.
The model at the heart of the study, called Hidropixel, treats every square metre of the catchment as an independent micro-basin. It works in two stages. First, it calculates how much of the rain falling on each pixel becomes surface runoff, using the Soil Conservation Service Curve Number method, which classifies runoff potential from soil type, land use and an assumed antecedent moisture condition. Second, it converts that excess water into a small hydrograph for each pixel and routes it downhill to the outlet, superimposing all the individual contributions to build the catchment’s total flood response. Because the catchment is discretized into more than a million active cells, the researchers developed a grouped convolution strategy that aggregates pixels sharing identical Curve Number and travel-time values, cutting computation by orders of magnitude: all 39 observed events at the two outlets run in under five minutes on a standard workstation, and a full spatialized simulation along the drainage network takes roughly two minutes per storm.
A central question was which version of the Curve Number method to use. The classic formulation fixes the ratio between initial abstraction and the soil’s potential maximum retention at 0.2, a value that recent research suggests is often too high for agricultural catchments, suppressing runoff for small and moderate storms. The team therefore compared four formulations: the standard method, two variants with a reduced abstraction ratio proposed by Hawkins and Woodward, and a generalized relation from Jain and colleagues in which the initial abstraction depends dynamically on the size of the storm itself. Each was tested in both a lumped configuration, where a single area-weighted Curve Number represents the whole basin, and the fully distributed pixel-scale configuration.
The verdict was clear but qualified. The standard method severely underestimated runoff volumes, with an average negative Nash-Sutcliffe efficiency of −0.32 and a bias of −91 percent; in many small events it simulated no runoff at all because rainfall never exceeded the assumed initial abstraction. The Hawkins and Woodward variants improved matters but still left substantial volume deficits, with biases near −60 and −71 percent respectively. The Jain method performed best, achieving the highest efficiency score of 0.17, the lowest relative error, and the smallest bias at 16 percent. The distributed approach also statistically outperformed the lumped one across all formulations, though the authors are careful to characterize this as a modest but consistent benefit rather than a dramatic gain in accuracy. Explicitly resolving the spatial patchwork of runoff-producing areas allows the model to identify active contributing zones that basin-wide averaging would dampen.
Even the best configuration exposed a structural weakness. Across all four methods, the volumetric error remained strongly correlated with the maximum 30-minute rainfall intensity, peaking with the Jain method at a rank correlation of 0.71. The Curve Number framework, built on cumulative storm totals, simply cannot distinguish a prolonged drizzle from a violent cloudburst, yet it is precisely the short, intense storms that dominate Hortonian, infiltration-excess runoff on crusted loess soils. The model consequently dampens minor events while amplifying high-intensity ones. The authors also note that a fixed annual Curve Number ignores the seasonal swing between bare winter soil and a fully developed summer crop canopy, and that excluding the traditional five-day antecedent rainfall adjustment, a deliberate choice supported by their own correlation analysis, leaves the model blind to the real pre-storm saturation state. They stress that substantially better performance is achievable on this same catchment with locally calibrated, event-specific approaches; the modest skill reported here reflects the deliberate choice of a parsimonious, literature-based scheme suited to places where calibration data do not exist.
The second stage of the analysis concerned routing, the translation of runoff into downstream flow. The researchers contrasted two ways of estimating flow velocity and travel time: the SCS velocity method, which segments each flow path into sheet flow, shallow concentrated flow and open channel flow, and the SWRRB method, a simpler semi-empirical formulation relying on path-averaged parameters. Both were confronted with observed concentration times derived from 39 rainfall-runoff events recorded between 2014 and 2024, using an inflection-point method on the hydrograph recession limb. Observed response times were remarkably similar at the two nested outlets, with medians of 50 and 55 minutes for the 84-hectare and 111-hectare basins, but fluctuated widely between events, from roughly 15 to 85 minutes, and correlated significantly with antecedent wetness: wetter soils shortened the response.
Against this dynamism, both static routing schemes overestimated travel times, with median errors of 27 percent for SWRRB and 38 percent for the SCS method, and maximum relative errors reaching 300 and 350 percent. Part of this systematic bias is attributed to the 1-metre digital elevation model itself: such fine resolution captures micro-topographic sinuosity that structurally elongates flow paths and inflates calculated travel times, particularly along the longest hydraulic path, which extends over 2,036 metres. Yet when the full hydrographs were compared, the two routing strategies proved statistically equivalent, with median Kling-Gupta efficiencies of 0.35 and 0.34. The difference in their calculated concentration times, about seven minutes, is negligible relative to typical storm durations in this small headwater basin, where travel times are short compared with the storm itself. The choice between the two methods should therefore be guided by modelling objectives: the SCS approach offers finer spatial detail but is vulnerable to digital terrain artifacts, while SWRRB’s averaging makes it more robust and easier to apply without local data.
The hydrograph analysis also revealed a regime-dependent skill. Model performance correlated positively with rainfall duration but negatively with maximum intensity, meaning acceptable simulations occurred mainly during prolonged, lower-intensity events, while the worst failures coincided with short, violent storms. Peak discharge errors showed no systematic bias, with medians between −7 and −9 percent, but wide dispersion, and extreme events frequently deviated by more than 100 percent, partly because measuring discharge during such floods pushes the monitoring infrastructure to its operational limits. Encouragingly, the timing of the runoff window was well captured: despite a consistent delay in time to peak of around 16 to 17 percent, base-time errors centred near zero, indicating that the routing architecture behaves consistently rather than erratically.
The final section turns these validated components into a spatially distributed flood susceptibility map. Rather than computing discharge only at the basin outlet, the model iteratively treats every pixel along the concentrated flow paths, delineated with a minimum accumulation threshold of 0.5 hectares, as a temporary outlet, producing peak discharge estimates along the entire drainage network. Applied to an observed multi-modal event in January 2024, the simulation reproduced the interplay between hydrodynamic attenuation on gentle slopes and peak amplification where tributary flows converge in phase, though it missed the first observed runoff peak, a direct illustration of the rigid abstraction threshold. Field and imagery checks, including a comparison with twelve ephemeral gullies observed after a storm in May 2026, supported the mapped flow paths, while minor pathways in the northern cultivated sector showed greater mobility linked to tillage practices.
Applied to synthetic 25-year and 100-year design storms, the framework, with an intensity-based adjustment of travel times, simulated a marked expansion of the active flow network and a near-doubling of peak discharge at the main outlet, from about 1,826 to 3,514 litres per second, with amplification exceeding 90 percent along the main thalweg. The authors insist these design-storm results are an exploratory scenario generated by the model structure, not a validated prediction. The principal limitation is that validation rests on a single, intensively monitored catchment whose two nested outlets are dependent evaluation points, so the relative performance of the tested methods cannot yet be generalized to other climates, soils or catchment sizes. Computational benchmarks on four larger Walloon catchments, from 1,500 to 4,000 hectares, suggest the framework is architecturally scalable, and extending the evaluation to contrasting environments is the natural next step toward an operational tool for pluvial flood risk assessment in unmonitored farmland.
Subject of Research: High-resolution mapping of pluvial flooding in ungauged agricultural catchments
Article Title: High-resolution mapping of pluvial flooding in ungauged agricultural catchments
Article References: Herpoel, M., Baert, P., Bielders, C., Swerts, G., & Degré, A. (2026). High-resolution mapping of pluvial flooding in ungauged agricultural catchments. Hydrology and Earth System Sciences, 30(20), 6661-6699. https://doi.org/10.5194/hess-30-6661-2026
Image Credits: AI Generated
DOI: 10.5194/hess-30-6661-2026
Keywords: High-resolution, mapping, pluvial, flooding, ungauged, agricultural, catchments, scientific research
Cite Scienmag News
Violet Maxwell. (October 29, 2026). Model Maps Flash-Flood Hotspots on Unmonitored Belgian Farmland. Scienmag. https://scienmag.com/model-maps-flash-flood-hotspots-on-unmonitored-belgian-farmland/
Violet Maxwell. "Model Maps Flash-Flood Hotspots on Unmonitored Belgian Farmland." Scienmag, 29 October 2026, https://scienmag.com/model-maps-flash-flood-hotspots-on-unmonitored-belgian-farmland/. Accessed 29 October 2026.
Violet Maxwell. "Model Maps Flash-Flood Hotspots on Unmonitored Belgian Farmland." Scienmag. October 29, 2026. https://scienmag.com/model-maps-flash-flood-hotspots-on-unmonitored-belgian-farmland/