


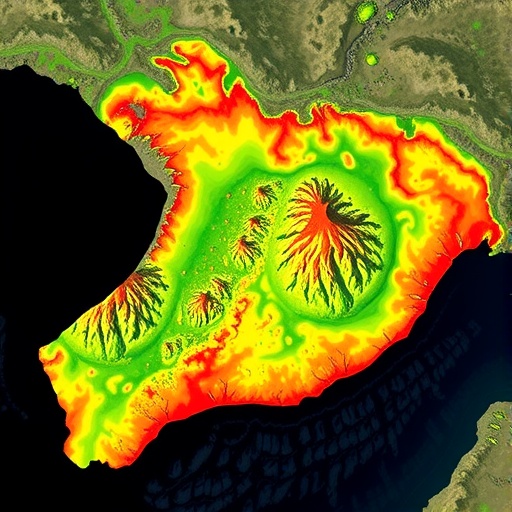
In the cobblestoned heart of São João del-Rei, a Brazilian colonial town where gilded Baroque churches rise above streets laid out during the eighteenth-century gold rush, scientists have taught an artificial intelligence model to read heat from space. By fusing thermal measurements from the Landsat 8 and 9 satellites with high-resolution optical imagery from Europe’s Sentinel-2 missions, a team of Brazilian geographers has generated some of the sharpest maps yet of how surface temperatures shift across a protected historic urban landscape. The results expose a subtle but measurable divide between the town’s cool, shaded, vegetation-draped corners and its sun-baked paved squares, and they show how machine learning can sharpen coarse satellite temperature data to a resolution fine enough to tell a narrow colonial lane apart from an open church square. The study, published in the journal Discover Cities, arrives as cities worldwide confront intensifying heat and as heritage managers search for ways to protect centuries-old urban fabric without freezing it in place.
São João del-Rei, in the state of Minas Gerais, has been under federal protection since 1938, when Brazil’s National Institute of Historic and Artistic Heritage, IPHAN, listed its historic core. The protected ensemble spans roughly 700 buildings that preserve the town’s origins as a mining route turned commercial hub, among them the Cathedral of Our Lady of the Pillar and the third-order churches of Our Lady of Mount Carmel and Saint Francis of Assisi, landmarks of the local Baroque-Rococo cycle. The fabric is defined by compact street networks, continuous façades, massive masonry walls and narrow rights-of-way—characteristics that urban climate scientists have long suspected shape how such places heat up and cool down. Whether these inherited colonial forms genuinely moderate surface temperatures, or merely appear to, has remained an open question. João Batista Ferreira Neto of the University of São Paulo and colleagues at the Federal University of São João del-Rei set out to test how far satellites and machine learning could push that conversation forward.
Their starting point was land surface temperature, or LST, a quantity that is often misunderstood. LST is not air temperature. It is the “skin” temperature of the exposed materials a satellite senses when it records thermal radiation—roofs, pavements, soil and vegetation canopies—estimated from the infrared energy those surfaces emit. It differs from the two-metre air temperature measured in meteorological shelters and should not be confused with mean radiant temperature, the radiative field a human body actually experiences on the street. Thermal sensors, however, are coarse. Landsat’s thermal band, resampled to 30 metres in standard products, cannot fully resolve the fine-grained mosaic of narrow streets, small roofs, shaded walls and pocket gardens that defines a historic centre. To circumvent that constraint, the researchers turned to spatial downscaling: training a statistical model at the resolution where thermal data exist, then applying the learned relationships to much sharper optical imagery—in this case pushing 30-metre thermal information down to 10 metres.
The workflow unfolded across three environments: Google Earth Engine handled satellite acquisition and preprocessing, Python carried the machine-learning pipeline, and QGIS supported cartographic production. From Landsat 8/9 Collection 2 Level-2 imagery, the team built median composites of surface temperature for January and July—the humid-summer and dry-winter faces of this tropical high-altitude climate—using every valid, cloud-free observation between 2019 and 2025. Clouds, shadows and cirrus were masked through quality bands, thermal values were converted to degrees Celsius with official calibration coefficients, and a 100-metre buffer around the protected perimeter absorbed edge effects during processing. Sentinel-2 Surface Reflectance imagery supplied the predictive ingredients: the Normalized Difference Vegetation Index (NDVI) for vegetation vigour, the Normalized Difference Water Index (NDWI) for moisture-related surface conditions, the Normalized Difference Built-up Index (NDBI) for impervious surfaces, a broadband albedo estimate for integrated reflectance, and an inverted soil-adjusted vegetation index, dSAVI, that highlights bare soil and sparsely vegetated ground. Shortwave-infrared bands were resampled to 10 metres so that every predictor shared the same grid.
The engine of the downscaling was CatBoost, a gradient-boosting algorithm prized for capturing non-linear relationships between environmental variables. The researchers trained the model to link Landsat-derived temperatures at 30 metres with the five Sentinel-2 indices aggregated to the same resolution, drawing on 50,000 randomly sampled points split 70/30 into training and hold-out sets, with ten-fold cross-validation on the training data. The tuned configuration used 600 iterations, a tree depth of eight, a learning rate of 0.15, L2 leaf regularization of 0.0001 and early stopping after 50 rounds. Once fitted, the model was applied to the 10-metre predictor cubes, producing downscaled temperature surfaces for each season; any gaps left by masking were filled with resampled Landsat data. A Random Forest benchmark was trained alongside for comparison, and the authors are explicit that the output is a model-derived redistribution of the 30-metre thermal signal, not a direct thermal measurement at street scale.
The performance figures were striking, particularly for the dry winter. In January, CatBoost explained about 81 percent of the variance in the reference temperatures, with a root-mean-square error of 1.25 degrees Celsius and a mean absolute error of 0.98 degrees. In July, it explained roughly 89 percent, with errors shrinking to 0.88 and 0.65 degrees respectively—outperforming Random Forest in both seasons. Residuals clustered near zero with a slight tendency toward underestimation, and most fell within about three degrees in summer and two degrees in winter. Just as telling was what the model revealed about seasonality. Predictor-removal tests, in which individual variables were deleted and the resulting error change measured, showed that the January model leaned most heavily on vegetation- and moisture-related signals: removing NDWI, the water index, inflicted the largest error increase of any predictor. In July, the built-up index NDBI took that role, suggesting impervious surfaces become the dominant statistical signature of temperature contrasts once the dry season strips away moisture differences. Curiously, NDBI ranked low in the model’s internal importance scores yet dominated the July removal test—a discrepancy the authors attribute to the two metrics probing different aspects of how the algorithm uses each variable.
The mapped patterns give those statistics a tangible geography. January’s downscaled surface ranged from 32.85 to 41.93 degrees Celsius, with the highest estimates over exposed impervious ground. July’s surface ran cooler and narrower, from 20.83 to 26.90 degrees, but painted a sharper mosaic. Compact, façade-lined segments such as Santo Antônio Street registered lower estimated temperatures than open paved spaces like the Square of Our Lady of the Rosary, with selected July contrasts reaching roughly 1.5 to 2.5 degrees. The Lenheiro Stream, historically tied to the town’s founding, emerged as a corridor of comparatively low estimated temperature, as did the wooded churchyard of the Church of Saint Francis of Assisi—while the treeless paved squares near the churches of Our Lady of Mount Carmel and Our Lady of the Rosary ran hotter. The pattern matches what urban ecology would predict: vegetation cools surfaces through shading and evapotranspiration, water bodies and moist ground dampen heating, and dark impervious pavements absorb solar energy.
The authors, however, wrap their findings in unusually careful language. The 10-metre maps are model-derived estimates rather than observations; they redistribute a 30-metre thermal signal guided by optical proxies, and the validation design—random sampling, with spatial autocorrelation a known risk—does not demonstrate accuracy at independent street locations. Nothing in the study directly measured street geometry, sky-view factors, wall thickness, material properties, air temperature, wind or human comfort, so the cool colonial lanes cannot be taken as proof of urban canyon effects or of the thermal inertia of stone and wattle-and-daub. The researchers instead treat the town’s inherited morphology as contextual interpretation. They invoke the notion of “ecological wisdom”—the idea that traditional builders arrived at climate-responsive forms through accumulated experience—only as a conceptual lens, noting that colonial builders are unlikely to have documented bioclimatic intentions, even if the persistence of compact streets, massive walls and vegetated churchyards creates a fabric that visibly interacts with surface heating.
That caution places the study within a wider and growing debate. Comparable research on the medina of Fes in Morocco, the Saharan city of Ghardaïa in Algeria, the historic Turkish city of Muğla and traditional villages in China’s Jiangnan region has linked compact form, narrow streets and traditional materials to moderated outdoor thermal conditions, and bodies such as ICOMOS now argue that cultural heritage belongs in climate action both as a vulnerable asset and as a potential resource. In São João del-Rei itself, projected increases in temperature and shifting heat- and cold-wave patterns lend the question practical urgency. The study, financed in part by the Brazilian coordination agency CAPES, positions its 10-metre maps as a first spatial layer: a reproducible, openly documented framework that flags where surface temperature contrasts exist within a protected historic centre and where future field campaigns should look. Confirming the underlying mechanisms, the authors write, will require direct morphological indicators, material surveys, shading simulations, mean radiant temperature estimates, in-situ microclimatic measurements and studies of how residents and visitors actually experience heat, shade and stone.
Even with those caveats, the achievement is notable. A machine-learning model has effectively transferred the thermal knowledge of a coarse satellite sensor onto the far finer canvas of Sentinel-2 imagery, revealing seasonal shifts in what controls urban heat within a heritage zone that has stood for nearly three centuries. As heat waves intensify across Brazil and beyond, tools of this kind could help conservation planners decide where to preserve shade-giving vegetation, how to manage surface materials and which public spaces most need cooling interventions—all without drilling a single hole in a colonial wall. The historic streets of São João del-Rei have survived gold booms, empire and modernization. With algorithms now reading their temperatures from roughly 700 kilometres above, they may also help teach a warming world what centuries of urban form have quietly known about staying cool.
Seasonal land surface temperature patterns and machine-learning-based spatial downscaling in the historic urban heritage area of São João del-Rei, Brazil
Machine learning downscaling of satellite derived land surface temperature in the historic urban heritage area of São João del-Rei Brazil
Neto, J. B. F., Leão, H. S., Freitas, M. S., & Pereira, G. (2026). Machine learning downscaling of satellite derived land surface temperature in the historic urban heritage area of São João del-Rei Brazil. Discover Cities, 3, Article 133. https://doi.org/10.1007/s44327-026-00318-9
AI Generated
10.1007/s44327-026-00318-9
land surface temperature, LST downscaling, historic urban heritage, urban remote sensing, machine learning, CatBoost, Sentinel-2, Landsat, urban heat, climate adaptation, São João del-Rei
Cite Scienmag News
Blake Davidson. (August 30, 2026). Machine learning refines satellite land temperature maps in historic São João del-Rei. Scienmag. https://scienmag.com/machine-learning-refines-satellite-land-temperature-maps-in-historic-sao-joao-del-rei/
Blake Davidson. "Machine learning refines satellite land temperature maps in historic São João del-Rei." Scienmag, 30 August 2026, https://scienmag.com/machine-learning-refines-satellite-land-temperature-maps-in-historic-sao-joao-del-rei/. Accessed 3 September 2026.
Blake Davidson. "Machine learning refines satellite land temperature maps in historic São João del-Rei." Scienmag. August 30, 2026. https://scienmag.com/machine-learning-refines-satellite-land-temperature-maps-in-historic-sao-joao-del-rei/


