


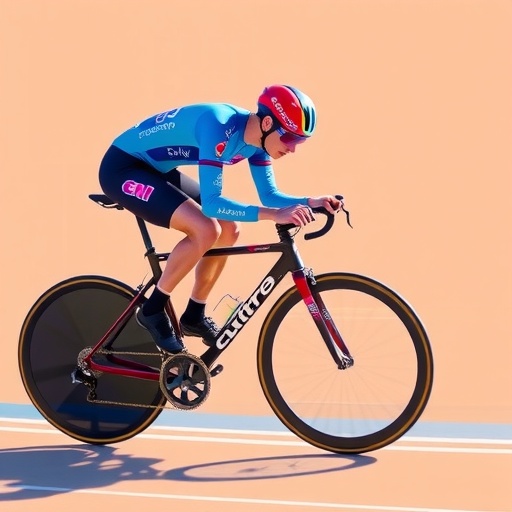
In the unforgiving world of track sprint cycling, where races are decided by hundredths of a second and medals hinge on fractions of a watt, coaches and sport scientists have long searched for the laboratory metric that best predicts who will fly fastest around a velodrome. A new multinational study has brought artificial intelligence to bear on that question, analyzing data from 333 elite male track cyclists to determine whether sophisticated machine learning algorithms can outperform traditional statistics in forecasting flying sprint performance. The answer, published in Sports Medicine – Open, is a striking lesson in both the power and the humility of modern data science.
The research, conducted by Taenam Kim and Seung-Bo Park, set out to address a persistent gap in sports science. For decades, performance prediction in sprint cycling has relied on multiple linear regression, a statistical technique that assumes each predictor contributes independently and in straight-line fashion to the outcome. But human physiology rarely obeys such tidy rules. The relationships between muscle power, body mass, pedaling cadence, and fatigue are tangled, interactive, and non-linear — precisely the kind of complexity that machine learning methods such as random forests are designed to untangle. Whether that theoretical advantage translates into real predictive gains for elite athletes had never been tested at this scale.
To find out, the researchers assembled one of the largest datasets ever compiled on elite track sprinters. Each of the 333 athletes completed a 30-second all-out sprint test on a cycle ergometer in laboratory conditions, a brutal assessment known as the Wingate-style test that drives athletes to their absolute physiological limits. The scientists then extracted eight predictors from each test: body mass, peak power output, 30-second mean power, mean cadence, relative peak power (peak power divided by body mass), 5-second maximal mean power normalized to body mass, maximal 5-second power decline, and percentage power drop. These variables together capture not only how much force an athlete can produce but also how quickly that capacity erodes under the metabolic stress of maximal effort.
The critical second step took the science out of the laboratory and onto the boards. Every athlete also completed flying 100-meter and 200-meter sprint tests in an indoor velodrome — the environment where elite competition actually happens. The flying 100-meter time, measured after a rolling build-up that allows riders to reach near-maximal speed, serves as a benchmark for pure top-end velocity. The flying 200-meter time, the qualifying event that seeds the sprint tournament at world championships and the Olympic Games, demands that athletes sustain high output for roughly twice as long, making fatigue resistance decisive. The difference between the two times — the 100-to-200-meter split — became a key focus of the analysis, isolating what happens in the second half of a maximal sprint when anaerobic fatigue begins to bite.
Armed with this dataset, the team built two families of predictive models. The first was a conventional multiple linear regression, the workhorse of exercise physiology. The second was a random forest, an ensemble machine learning method that constructs hundreds of decision trees, each trained on random subsets of the data and variables, then averages their predictions. Random forests excel at detecting non-linear relationships and interaction effects — for example, the possibility that peak power predicts time trial performance differently in heavier athletes than in lighter ones. Crucially, the researchers did not simply accept the algorithm’s default settings. They tuned the random forest’s hyperparameters through nested cross-validation on the training data, a rigorous procedure that prevents the model from silently memorizing the quirks of its training sample, and then evaluated both models on a held-out test set of athletes the algorithms had never seen.
The headline finding was as provocative as it was clean: machine learning did not decisively beat linear regression. When both approaches were compared on unseen data, the tuned random forest offered no meaningful advantage in predicting flying sprint times. In a field increasingly enamored with artificial intelligence, the result is a reminder that simpler models can be remarkably robust — especially when the number of predictors is modest and the underlying relationships, however complex they appear in theory, are well summarized by a few dominant variables.
And one variable dominated above all. In mutually adjusted linear regression models, 30-second average power was the only independent predictor of both flying 100-meter and flying 200-meter times. Peak power output — the single explosive burst of maximum wattage that many coaches treat as the holy grail of sprint testing — did not survive statistical adjustment. What mattered was not the highest point of the power curve but its sustained plateau: the ability to keep producing enormous power across the full half-minute of maximal effort. In physiological terms, the finding elevates anaerobic capacity and aerobic contribution to repeated high-intensity output over raw neuromuscular peak power as the true currency of track sprinting.
The second-half analysis sharpened the story further. When the researchers examined the 100-to-200-meter split time in unadjusted models, the metrics describing power decline — maximal 5-second power drop and percentage power drop — showed associations with slower finishing, consistent with the intuitive picture that athletes who fatigue faster lose more speed late in the sprint. But when those models were adjusted for peak power, the independent association of the decline metrics largely disappeared. Fatigue indices, in other words, appear to be entangled with an athlete’s absolute power production: stronger riders may show larger absolute power drops simply because they start from a higher ceiling, without necessarily being worse at sustaining speed relative to their capacity. It is a caution against reading fatigue metrics in isolation, a practice the authors suggest has misled aspects of athlete testing.
For coaches and performance directors, the practical implications are substantial. First, the study validates the humble 30-second ergometer sprint as a genuinely predictive testing tool: a single laboratory bout, requiring no velodrome access, explains a meaningful share of the variance in on-track flying sprint performance among the world’s best. Second, it redirects training emphasis. If sustained mean power — not peak power — is the independent predictor, then programs built predominantly around maximal neuromuscular peak development may be missing the mark for the velodrome’s most important demands. Interval work targeting power maintenance under accumulating metabolic stress deserves at least equal billing.
The study also carries a methodological message for the sports science community at large. Machine learning has swept through performance analytics, promise-laden and often hyped, yet this investigation demonstrates that algorithmic sophistication is not automatically synonymous with predictive superiority. With eight well-chosen laboratory predictors and 333 high-quality athlete observations, a properly specified linear model held its ground against a carefully tuned ensemble method. The researchers’ use of nested cross-validation and a held-out test set models the kind of analytical discipline the field needs: too many machine learning studies in sport report optimistic accuracy figures because their models were evaluated on data they had effectively already seen.
The work is not without boundaries. The sample comprised elite male track cyclists, so the findings cannot be assumed to generalize to female athletes, junior riders, or population-level recreational cyclists, whose physiology and performance determinants may differ. The cross-sectional design — a snapshot of each athlete at a single point in time — establishes prediction, not causation or response to training. And while the eight ergometer-derived predictors explained significant performance variance, velodrome performance also reflects factors no laboratory captures: bike handling, track geometry, aerodynamic positioning, tire pressure, environmental conditions, and the psychological machinery of maximal self-pacing.
Even so, the study stands as one of the most rigorous attempts to bridge laboratory testing and velodrome reality, and its central insight will resonate far beyond cycling. In elite sport, where testing budgets increasingly flow toward complex analytics, the message is refreshingly grounded: measure what athletes can sustain, not just what they can spike. The fastest men on the boards, the data say, are not necessarily those who touch the highest peak — but those whose power curve refuses to fall.
Cite Scienmag News
Blake Davidson. (September 4, 2026). Machine Learning Predicts Elite Male Sprint Cycling Performance in Multinational Study. Scienmag. https://scienmag.com/machine-learning-predicts-elite-male-sprint-cycling-performance-in-multinational-study/
Blake Davidson. "Machine Learning Predicts Elite Male Sprint Cycling Performance in Multinational Study." Scienmag, 4 September 2026, https://scienmag.com/machine-learning-predicts-elite-male-sprint-cycling-performance-in-multinational-study/. Accessed 4 September 2026.
Blake Davidson. "Machine Learning Predicts Elite Male Sprint Cycling Performance in Multinational Study." Scienmag. September 4, 2026. https://scienmag.com/machine-learning-predicts-elite-male-sprint-cycling-performance-in-multinational-study/


