


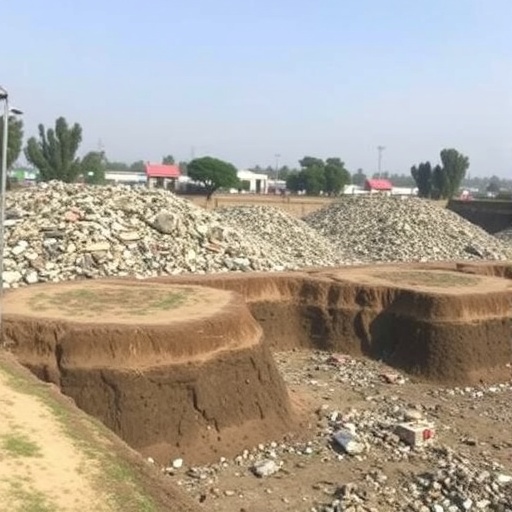
When rainwater seeps through the mountains of unsorted garbage that pile up in the world’s fast-growing cities, it does not simply vanish. It becomes leachate, a dark, chemically potent liquid that carries organic matter, salts, ammoniacal nitrogen and heavy metals such as cadmium, lead, chromium, arsenic and mercury into the soil beneath a landfill and, eventually, into the water that millions of people drink. A new study of Jammu, a rapidly expanding city in northern India, offers one of the most detailed pictures yet of how this process unfolds in a mid-sized, rapidly urbanizing city, and it reveals that the garbage a neighbourhood throws away is shaped just as much by income as by culture, while the water contamination left behind respects no such boundaries.
The research, published in Case Studies in Chemical and Environmental Engineering, was carried out by Bilal Ahmad Wani, Pervez Alam and Zishan Aslam, who set out to close a persistent gap in the scientific literature. While metropolitan giants such as Delhi and Mumbai have been studied extensively, smaller cities undergoing swift urban growth remain largely invisible in waste and water research, even though their landfills often sit uncomfortably close to rivers and well fields. Jammu, known as the City of Temples, straddles the Tawi River in the Shivalik Hills and produces between 350 and 400 metric tons of municipal solid waste every day. Its disposal infrastructure consists of a closed legacy landfill at Bhagwati Nagar and an active dump at Kot Bhalwal, both perilously near surface and subsurface water sources.
To capture how socioeconomic status influences waste, the team divided the city into three municipal zones and selected fifteen wards, five each from high-income, middle-income and low-income groups. Within each ward, five households were given labelled garbage bags and asked to deposit everything they discarded over a 24-hour period, producing a sample of 75 households whose waste was hand-sorted into nine categories: cardboard, paper, polythene, plastic, crockery, food and organic waste, aluminium foil, glass and textiles. Moisture content was determined by oven-drying samples at 105 degrees Celsius for 24 hours, and bulk density was measured by loosely filling a 15-litre container and weighing the contents. The result is a granular, street-by-street portrait of urban consumption in a developing city.
The compositional differences across income groups were striking. High-income neighbourhoods such as Gandhi Nagar generated waste that was, on average, just over 80 percent organic, with the highest single reading reaching 88.8 percent, a signature of abundant food preparation and frequent social gatherings. These areas also produced more packaging materials, single-use plastics and textiles, reflecting convenience-driven lifestyles; Gandhi Nagar recorded the city’s highest cardboard share at 4.1 percent, while Channi Rama registered 12 percent polythene. Middle-income wards showed a mixed profile, with Kanji House topping the polythene scale at 16.9 percent, a legacy of dense networks of small shops and street vendors. Low-income areas were dominated by organic matter averaging nearly 68 percent, alongside substantial paper, cardboard and plastic from bustling informal markets such as Nai Basti.
Perhaps the most counterintuitive finding concerned the physical character of the waste. Bulk density rose steadily as income fell, from 386.7 kilograms per cubic metre in high-income zones to 586.7 kilograms per cubic metre in low-income areas, meaning poorer neighbourhoods generate heavier, more compact waste that demands greater handling effort but less storage space. Moisture content, however, peaked in middle-income areas at 82.13 percent, exceeding the 65.17 percent measured in low-income wards and the 55.64 percent in affluent ones. The researchers suggest that better segregation, drier garden waste and improved storage practices among wealthy households may explain the anomaly. These physical properties matter enormously for management: high moisture favours composting but cripples incineration efficiency, while density dictates vehicle capacity, collection frequency and route design.
Having characterized the waste, the team turned to the water. Nine samples were collected: three from the Tawi River at upstream, midstream and downstream points, three from borewells near the legacy Bhagwati Nagar landfill and three near the active Kot Bhalwal site. All samples were analysed for pH, electrical conductivity, total dissolved solids, turbidity, dissolved oxygen, biochemical oxygen demand over five days, alkalinity, salinity, oxidation-reduction potential, resistivity and free carbon dioxide, following standard methods from the Bureau of Indian Standards, the World Health Organization and the American Public Health Association.
The physico-chemical results bore the unmistakable fingerprint of leachate. Every sample was slightly acidic, with pH below the neutral threshold of 7, a condition the authors attribute to acidic compounds percolating from decomposing waste. Turbidity was the most alarming parameter: all nine samples exceeded the drinking-water standard of 5 nephelometric turbidity units, with readings ranging from 12 to 45 NTU and a mean of 23.33, indicating suspended solids and likely microbial contamination. Conductivity peaked at 878 microsiemens per centimetre in surface water near Bhagwati Nagar, the legacy site whose historical waste disposal continues to leach dissolved ions years after closure. Most tellingly, biochemical oxygen demand was low in the river but exceeded the 3 milligrams per litre threshold in every single groundwater sample, with the highest values found nearest the waste dumps, evidence that biodegradable organic pollutants are migrating underground.
Free carbon dioxide told a complementary story. Surface water held modest concentrations of 8 to 10 milligrams per litre, but groundwater values climbed as high as 45 milligrams per litre, the product of intense microbial respiration as subsurface bacteria consume organic contaminants. Dissolved oxygen dipped to 6.3 milligrams per litre near the landfills before recovering farther away, consistent with oxygen depletion around zones of organic decomposition. Salinity and resistivity gradients mirrored conductivity, with the ion-rich, low-resistivity signature of contamination concentrated in the south of the city near Bhagwati Nagar and fading toward the cleaner aquifers around Kot Bhalwal.
To transform point measurements into a city-wide picture, the researchers applied Inverse Distance Weighted interpolation within QGIS, a deterministic technique that estimates values at unsampled locations by weighting nearby measurements more heavily. A power coefficient of two was selected after sensitivity testing, and the outputs were clipped to the study boundary and validated against field observations. The resulting maps revealed a clear spatial gradient: elevated turbidity, conductivity, BOD and free CO2 clustered around the landfill zones and diminished with distance, providing quantitative spatial evidence that proximity to waste disposal, not diffuse urban pollution, drives degradation. The authors chose IDW over kriging because the limited number of sampling points and weak spatial autocorrelation made variogram modelling unreliable, and over spline methods because splines can over-smooth sparse data.
The Water Quality Index delivered the study’s most sobering verdict. Half of the sampled locations fell into the “Poor” category, meaning the water is unfit for drinking without treatment, while the remainder sat clustered perilously close to the threshold value of 100 that separates acceptable from polluted, with scores such as 99.67 at one Bhagwati Nagar site and 99.36 near Kot Bhalwal. In such a borderline state, minor fluctuations in contaminant levels could tip a water source from usable to hazardous. A one-way analysis of variance across the groundwater sites produced an F-value of 0.236 with a p-value of 0.983, indicating no statistically significant differences among locations, which the authors interpret as evidence of widespread, relatively uniform contamination rather than isolated hotspots, a finding that magnifies the scale of the problem.
The team recommends an income-specific, decentralized waste management strategy for Jammu: source segregation, composting and recycling in affluent wards; improved collection and regulation of mixed streams in middle-income areas; and community-based collection systems and material recovery facilities in low-income neighbourhoods. Critically, they call for engineered liners, efficient leachate collection and treatment, and regular groundwater monitoring at landfill boundaries. The study has limitations, including a single sampling season and a modest number of water sites, and it did not analyse emerging micropollutants. But its integrated framework, linking what a city throws away to what its citizens ultimately drink, offers a model that under-resourced cities across the developing world can replicate before their hidden water crisis becomes an irreversible one.
Cite Scienmag News
Bethany Barker. (September 8, 2026). Income-linked landfill impacts degrade groundwater quality in Jammu city. Scienmag. https://scienmag.com/income-linked-landfill-impacts-degrade-groundwater-quality-in-jammu-city/
Bethany Barker. "Income-linked landfill impacts degrade groundwater quality in Jammu city." Scienmag, 8 September 2026, https://scienmag.com/income-linked-landfill-impacts-degrade-groundwater-quality-in-jammu-city/. Accessed 8 September 2026.
Bethany Barker. "Income-linked landfill impacts degrade groundwater quality in Jammu city." Scienmag. September 8, 2026. https://scienmag.com/income-linked-landfill-impacts-degrade-groundwater-quality-in-jammu-city/


