


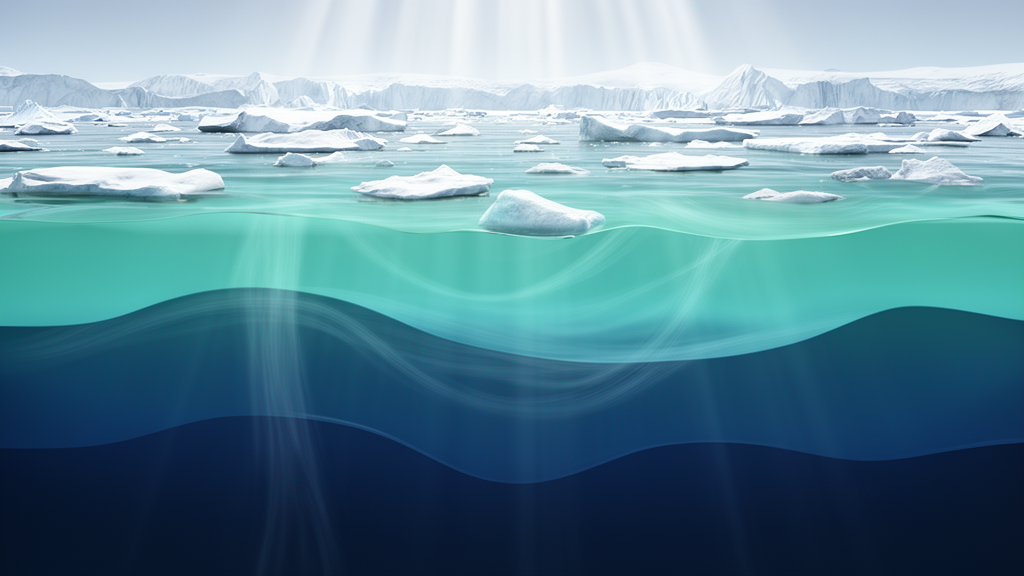
Some twenty thousand years ago, Earth was a profoundly different planet. Vast ice sheets buried Canada and northern Europe, sea level stood more than a hundred metres lower than today, and global surface temperatures were roughly 4.5 to 6 degrees Celsius colder than in pre-industrial times. For climate scientists, this Last Glacial Maximum is more than a curiosity: it is the closest thing to a natural laboratory for testing whether the computer models used to forecast future warming can handle a climate state radically unlike the one they were built on. A new study published in the journal Climate of the Past takes that test in a direction no previous assessment has gone, by comparing model simulations against reconstructions of the density of the ocean’s surface waters during the deep freeze.
Surface seawater density is a deceptively powerful diagnostic. It is the combined product of temperature and salinity, and because density gradients steer ocean circulation through geostrophic balance, getting density right means getting the ocean’s engine right. Until now, model evaluations of the glacial ocean have focused almost entirely on sea surface temperature, leaving the coupled temperature-salinity signal largely unexplored. Héloïse Barathieu of the University of Bordeaux and her colleagues, working with researchers at the Laboratoire des Sciences du Climat et de l’Environnement, exploited a recently developed Bayesian calibration method that converts the oxygen isotope composition of foraminiferal shells — the microscopic calcite tests left behind by plankton that drifted through the glacial ocean — into quantitative estimates of annual surface density, complete with explicit uncertainty ranges.
The team assembled a database of 474 density reconstructions spanning all major ocean basins, each available for both the Last Glacial Maximum and the late Holocene, which serves as a stand-in for the pre-industrial baseline. Against this dataset they pitted sixteen climate model simulations from the third and fourth phases of the Paleoclimate Model Intercomparison Project, known as PMIP3 and PMIP4, the coordinated exercises that feed into the assessments of the Intergovernmental Panel on Climate Change. Two further simulations had to be discarded because of inconsistencies in their salinity data. Model outputs were regridded onto a common one-degree grid, and seawater density was computed using the thermodynamically consistent TEOS-10 framework via the Gibbs Seawater Python package, ensuring that every simulation was judged on an identical physical footing.
The headline finding is that the models get the big picture right but consistently undershoot the magnitude of the change. All sixteen simulations produce positive density anomalies between the glacial and pre-industrial oceans, agreeing on the sign of the shift, but their spatially averaged anomalies range only from about 0.7 to 1.6 kilograms per cubic metre, with a mean near 1.1. The reconstructions, by contrast, average around 1.6 kilograms per cubic metre. When the researchers examined the full statistical distributions of anomalies, using Kolmogorov–Smirnov statistics, interquartile range overlap and Monte Carlo propagation of reconstruction uncertainties, none of the simulations satisfied all three agreement criteria simultaneously. Part of the mismatch may stem from the uneven geography of the sediment cores, which cluster near coastlines where runoff and upwelling make simulation notoriously difficult.
The most striking result concerns what drives the discrepancies. Because density responds to both heat and salt, the team used a Shapley decomposition — a technique that partitions the total difference fairly between temperature and salinity regardless of the order of attribution — to separate the two contributions. Salinity emerged as the dominant culprit. The link traces back to the hydrological cycle: during the glacial period, tropical precipitation fell more sharply than evaporation, leaving surface waters saltier and denser. When the researchers plotted simulated density anomalies against simulated precipitation anomalies, a robust linear relationship appeared, with a coefficient of determination of 0.67 in the tropics and 0.64 globally. Models that best reproduced the reconstructed density signals were precisely those that simulated the strongest reductions in low-latitude rainfall.
Ranking the individual simulations revealed a clear hierarchy. Taylor diagrams, which condense spatial correlation, variability and error into a single plot, together with metrics such as root mean square error, bias, Nash–Sutcliffe efficiency and the Kling–Gupta efficiency, showed that the two iLOVECLIM experiments, MRI-CGCM3, IPSL-CM5A2 and MPI-ESM consistently performed well, with the iLOVECLIM runs achieving root mean square errors near 0.9 kilograms per cubic metre and Kling–Gupta efficiencies of 0.87. At the other end, the HadCM3 family and MIROC-ESM lagged behind, hampered by pronounced negative biases — a systematic tendency to underestimate reconstructed densities. Encouragingly, no simulation was wholly inadequate; all achieved Kling–Gupta efficiencies of at least roughly 0.5, indicating moderate to good overall skill.
That global comfort, however, masks serious regional trouble. Zooming into the Indian Ocean, the team split the basin at the Equator into monsoon-dominated northern and subtropical southern sectors. Most simulations handled the Indian Ocean reasonably well in both periods, but performance was systematically weaker in the north than in the south. The iLOVECLIM simulations, stars of the global evaluation, collapsed in the North Indian Ocean, with Kling–Gupta efficiencies approaching zero — a vivid demonstration that strong global scores can conceal deep regional failures, and that ensemble averages would have hidden the problem entirely.
The researchers then probed one of the tropical Indian Ocean’s defining features: the west–east gradient in surface properties, the mean-state backdrop to the Indian Ocean Dipole, a climate oscillation that many modern models already misrepresent. Proxy reconstructions indicate that during the Last Glacial Maximum this zonal density gradient weakened, with an anomaly close to minus one kilogram per cubic metre, reflecting stronger cooling in the east than the west and associated salinity changes. Yet only seven of the fourteen eligible simulations — exactly half — reproduced the correct sign and magnitude within the reconstruction’s 68 percent uncertainty range. HadCM3-ICE-6G_C and CESM1.2 came closest, and the authors note that the choice of ice-sheet reconstruction, which reshapes atmospheric circulation, jet structure and stationary waves, likely influences how well a model captures this gradient.
Why does any of this matter beyond the halls of paleoclimate science? Because the same models being graded here are the ones projecting how monsoons, ocean circulation and tropical rainfall will respond to ongoing warming. If a model cannot reproduce how salinity and density shifted when the planet last underwent a massive climate transition, its handling of the hydrological cycle — arguably the most consequential variable for human societies — remains open to doubt. The study’s authors argue that improving the representation of regional hydrological changes is crucial for reducing uncertainties in both paleoclimate simulations and future projections, and they call for expanding density reconstructions into the poorly sampled open ocean.
The work also signals a methodological shift. By evaluating each simulation individually rather than blending them into an ensemble mean, and by deploying a battery of complementary diagnostics across global, basin and zonal-gradient scales, the study offers a template for stricter model accountability. The authors suggest that integrating such datasets into statistical constraint frameworks and data assimilation could eventually identify which models most faithfully reproduce past climate states. For now, the message is sober but constructive: the models pass the broad test of an ice-age ocean, yet the salt in the water — and the rain that controls it — remains their hardest exam.
Subject of Research: Evaluation of PMIP3 and PMIP4 Last Glacial Maximum climate simulations using foraminiferal oxygen-isotope-based ocean surface density reconstructions
Article Title: Using ocean surface paleo-density to evaluate PMIP3 and PMIP4 Last Glacial Maximum climate simulations
Article References: Using ocean surface paleo-density to evaluate PMIP3 and PMIP4 Last Glacial Maximum climate simulations. (n.d.). https://doi.org/10.5194/cp-22-1803-2026
Image Credits: AI Generated
Keywords: Last Glacial Maximum, paleoclimate, climate models, PMIP, ocean surface density, foraminifera, oxygen isotopes, sea surface salinity, Indian Ocean Dipole, hydrological cycle, Climate of the Past, model-data comparison
Cite Scienmag News
Violet Maxwell. (October 8, 2026). Ice Age Ocean Density Puts Climate Models to the Test. Scienmag. https://scienmag.com/ice-age-ocean-density-puts-climate-models-to-the-test/
Violet Maxwell. "Ice Age Ocean Density Puts Climate Models to the Test." Scienmag, 8 October 2026, https://scienmag.com/ice-age-ocean-density-puts-climate-models-to-the-test/. Accessed 8 October 2026.
Violet Maxwell. "Ice Age Ocean Density Puts Climate Models to the Test." Scienmag. October 8, 2026. https://scienmag.com/ice-age-ocean-density-puts-climate-models-to-the-test/


