


Northern Pakistan is heading for a hotter, more built-up future, according to a new modeling study that projects the region’s land cover, surface temperatures, and rainfall decades ahead. Researchers Imtiaz Ahmad and Wang Ping of Northeast Normal University in China combined satellite records spanning two decades with a hybrid cellular automata–Markov (CA-Markov) model to forecast how the Dir Districts, a mountainous region in Khyber Pakhtunkhwa province, will change through 2040 and 2060. Their projections, published in the open-access journal Discover Forests, paint a picture of steady urban expansion, shrinking vegetation, and surface temperatures that could exceed 54 degrees Celsius by mid-century.
The study region occupies a dramatic stretch of terrain between roughly 700 and 3,500 meters above sea level in the foothills of the Malakand Division, spanning latitudes from 34°22′N to 35°50′N and longitudes from 71°2′E to 72°3′E. The area experiences a semi-arid climate, with winter temperatures dipping below 11 degrees Celsius and summer values reaching around 40 degrees, and moderate rainfall that peaks at about 242 millimeters in March. Steep slopes, plains, and mountains create a mosaic of subtropical dry deciduous and dry temperate pine forests, agricultural land, and rapidly growing settlements, making Dir an ideal natural laboratory for studying how land use change reshapes local climate.
To establish what has already happened, the researchers turned to the archive of Landsat satellites, drawing on imagery from Landsat 5 Thematic Mapper, Landsat 7 Enhanced Thematic Mapper Plus, and Landsat 8 Operational Land Imager for the years 2000, 2010, and 2020. Only scenes with cloud cover below 20 percent were selected, and all imagery underwent radiometric calibration and atmospheric correction to make the different sensors comparable across decades. The team also repaired the well-known data gaps in Landsat 7 imagery caused by the failure of its scan line corrector, filling missing pixels through interpolation and by integrating Landsat 8 data. Processing was carried out in Google Earth Engine along with ArcGIS, QGIS, and ENVI.
Land cover was classified into six categories—built-up areas, barren land, vegetation, water bodies, grassland, and wetland—using a Random Forest machine learning classifier trained on samples interpreted from high-resolution imagery. The dataset was split 70:30 for training and validation, and performance was assessed with confusion matrices. The results were remarkably strong: overall classification accuracy reached 92 percent in 2000, 94 percent in 2010, and 91 percent in 2020, with Kappa coefficients of 0.91, 0.92, and 0.90 respectively, giving the researchers a robust foundation for both trend analysis and future simulation.
The historical record revealed clear signatures of urbanization. Between 2000 and 2020, built-up areas in the Dir Districts expanded by roughly 247 square kilometers, a net gain of 4.7 percent of the study area. Vegetation cover moved in the opposite direction, declining by 4.75 percent, a loss of 54.52 square kilometers, while wetland shrank by 0.62 percent and barren land by 0.35 percent. Water bodies remained essentially stable, and grassland recovered slightly, a rebound the authors attribute in part to large government afforestation campaigns such as the Billion Trees Afforestation Project and the Ten Billion Tree Tsunami Program, which have boosted forest cover in Khyber Pakhtunkhwa since 2010. Even so, forests cover only about 5.1 percent of Pakistan’s total land area, and deforestation pressures remain severe in the north. The relatively modest 4.7 percent growth in Dir’s built-up area, despite Pakistan’s booming urban population, reflects the restraining influence of the district’s steep mountainous terrain, its agriculture-centered economy, and slower infrastructure development.
Land surface temperature, retrieved from the satellites’ thermal bands through a standardized four-step conversion—from digital numbers to spectral radiance, to brightness temperature, to Celsius, and finally to surface temperature corrected for emissivity—rose consistently across every land cover class except water bodies. Built-up areas and barren land registered the highest mean temperatures, consistent with their low albedo, reduced evapotranspiration, and high heat absorption, while vegetated areas stayed coolest. By 2020, maximum surface temperatures had climbed past 50.95 degrees Celsius, forcing the team to add a new category for extreme heat beyond their standard classification range. To make temperatures comparable across years despite differences in season and terrain, the researchers standardized the LST images using a reference-based normalization and restricted part of their analysis to pixels within a narrow 100-meter elevation band, reducing the confounding effect of altitude.
Precipitation told a more volatile story. Average rainfall intensity rose from 47.46 millimeters in 2000 to 67.65 millimeters in 2010, suggesting a wetter decade possibly linked to shifts in atmospheric circulation, before collapsing to an average of just 21.06 millimeters in 2020, with minimum values dropping to 13 millimeters. The authors suggest this sharp decline may reflect climatic anomalies, shifting monsoon patterns, or broader climate change effects on regional hydrology, while acknowledging the limitations of their modeling framework in capturing such variability.
With the historical baseline established, the team deployed the CA-Markov model to peer into the future. This hybrid approach marries the temporal transition probabilities of Markov chains—which calculate the statistical likelihood of one land category converting into another—with the spatial rules of cellular automata, which govern how changes propagate between neighboring cells based on local suitability. The model was trained on the 2000–2010 transition, validated with Kappa statistics, and informed by suitability surfaces derived from fuzzy membership functions and multi-criteria evaluation. Continuous variables like temperature and rainfall were discretized into categorical intervals so the cellular automata framework could operate on them. The same machinery was then applied to simulate future LST and precipitation grids for 2040 and 2060, conditioned on projected land cover change.
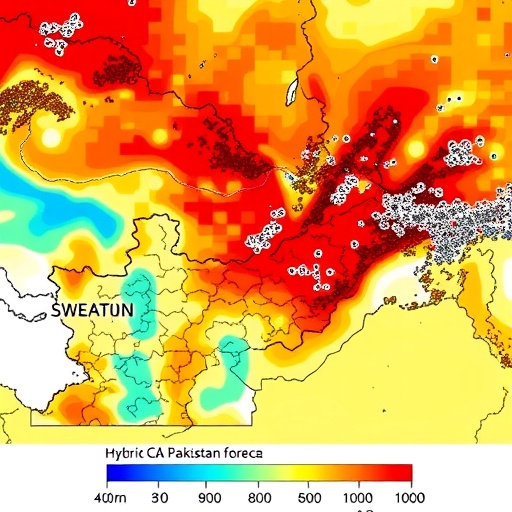
The projections are striking. Built-up areas are forecast to expand by a further 2.39 percent by 2040, while vegetation declines by 8.05 percent, wetland by 5.61 percent, and barren land by 6.89 percent. By 2060 the pace of change slows—vegetation falls another 0.247 percent and built-up area grows by only 0.007 percent—but the cumulative transformation is substantial. More alarming are the temperature projections: maximum land surface temperatures are expected to exceed 47 degrees Celsius in 2040 and climb beyond 54 degrees Celsius by 2060, with the most intense warming concentrated in the southern and central parts of the region. Precipitation, by contrast, shows a persistent spatial gradient, with southern and central areas receiving higher rainfall (46 to 56 millimeters) than the drier northern zones (21 to 29 millimeters) in both projected years.
One of the study’s most intriguing findings is what did not emerge: a strong link between temperature and rainfall. Across the historical period, the coefficient of determination between land surface temperature and precipitation was a negligible 0.005 in 2000 and 2010 and 0.007 in 2020. The projected years fared little better, with R-squared values of 0.019 for 2040 and 0.015 for 2060. This near-total decoupling suggests that surface temperature variations in Dir are driven primarily by land use change and urbanization rather than by precipitation. The authors point to the region’s complex climatic machinery—the Indian Summer Monsoon, westerly disturbances, orographic lifting on windward slopes, and soil moisture feedbacks that partition surface energy between sensible and latent heat—as factors operating largely independently of local surface temperature. In drier years, reduced soil moisture suppresses evaporative cooling and pushes temperatures up without any compensating rainfall increase, a mechanism evident in the hot, dry conditions of 2020.
A sensitivity analysis reinforced the stakes. Under an accelerated urbanization scenario assuming 5 percent built-up growth per decade, temperatures surged past 47 degrees Celsius in urban zones, whereas slower growth of 1 percent per decade produced more moderate warming. Rainfall scenarios of plus or minus 20 percent dramatically altered water availability, with drier futures worsening scarcity in the north while wetter conditions boosted supplies in the south and center. Notably, local interventions such as green infrastructure and sustainable urban planning proved effective at dampening the urban heat island effect, offering a concrete lever for policymakers.
For a region where Pakistan’s urban population has more than tripled since 1981 and is projected to reach half the national total by 2030, the message is unambiguous. The combination of machine learning classification, satellite thermal retrieval, and hybrid CA-Markov simulation provides a transferable framework—one already applied successfully in Multan, Quetta, Lahore, and cities across South Asia—for anticipating where growth will collide with environmental limits. The authors argue that embedding such predictive models in urban planning could help direct green space investment, regulate land conversion, and protect vulnerable ecosystems before the most extreme projected temperatures become reality. As mountain communities across the Hindu Kush and Himalayan foothills grapple with warming that outpaces global averages, studies like this one turn decades of satellite data into a roadmap for adaptation, showing precisely where the heat will land and which landscapes can still be saved.
Cite Scienmag News
Violet Maxwell. (September 7, 2026). Hybrid CA-Markov model forecasts land use, temperature, precipitation in Northern Pakistan. Scienmag. https://scienmag.com/hybrid-ca-markov-model-forecasts-land-use-temperature-precipitation-in-northern-pakistan/
Violet Maxwell. "Hybrid CA-Markov model forecasts land use, temperature, precipitation in Northern Pakistan." Scienmag, 7 September 2026, https://scienmag.com/hybrid-ca-markov-model-forecasts-land-use-temperature-precipitation-in-northern-pakistan/. Accessed 7 September 2026.
Violet Maxwell. "Hybrid CA-Markov model forecasts land use, temperature, precipitation in Northern Pakistan." Scienmag. September 7, 2026. https://scienmag.com/hybrid-ca-markov-model-forecasts-land-use-temperature-precipitation-in-northern-pakistan/


