


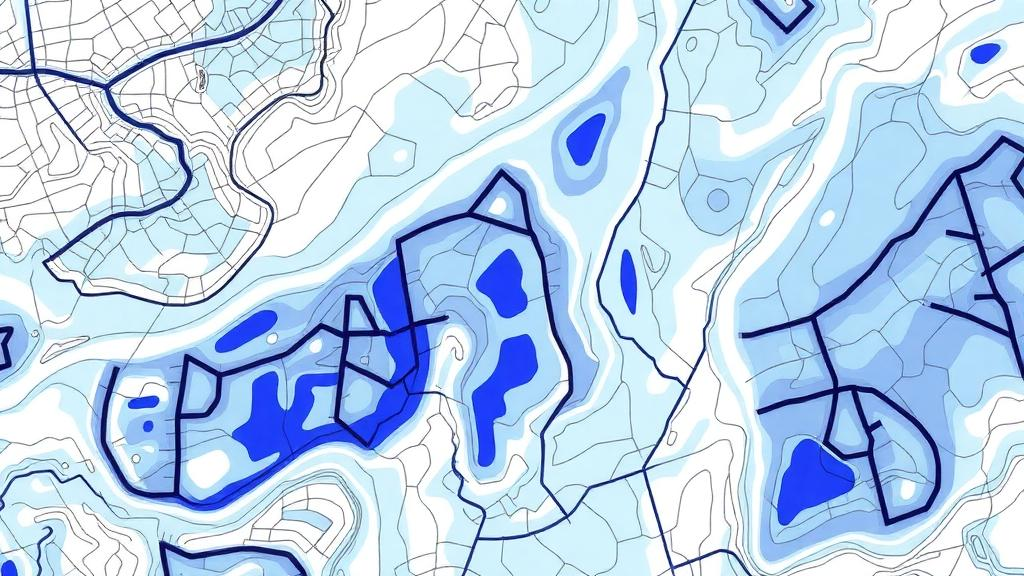
In the mountains of Rize Province in northern Türkiye, landslides are a persistent threat to communities and infrastructure. A new study in Environmental Monitoring and Assessment by Adem Kursat Ozcan and Candan Gokceoglu examines a question that sounds technical but has real consequences for hazard planning: when machine learning models predict where landslides are likely to occur, which matters more—the way the landslide record itself is drawn, or the land cover dataset fed into the model? The research, conducted in the Taslidere Catchment, compared two fundamentally different landslide inventories.
The first was a conventional point-based dataset of 878 landslide locations mapped in 2015, the kind of record long used in susceptibility studies. The second was a newly developed high-resolution polygon-based inventory capturing 2,247 shallow translational landslides, delineating the footprint of each failure rather than reducing it to a single coordinate. The team also tested three land cover datasets: CORINE Land Cover 2018, the standardised pan-European product; a dataset derived from Türkiye's national forest stand maps; and UASIS, the country's National Land Cover Classification and Monitoring System.
All models used conditioning factors derived from 10-metre-resolution raster datasets, keeping the environmental inputs consistent across experiments. Seven machine learning algorithms were implemented, and the results showed a clear hierarchy. Ensemble methods—extreme gradient boosting (XGB), random forest (RF), and categorical boosting (CAT)—consistently delivered the highest predictive performance, measured by the area under the receiver operating characteristic curve (AUC).
The decisive finding concerned inventory representation. Models built on the polygon-based inventory achieved AUC values exceeding 0.94, with the best overall result—XGB reaching an AUC of 0.9471—coming from the polygon inventory combined with the forest stand-derived land cover dataset. By contrast, models based on the older point inventory produced substantially lower AUC values, generally between 0.78 and 0.83.
That gap is large by the standards of susceptibility mapping. It indicates that how landslides are represented in the training data exerts a considerably stronger influence on model performance than the choice among the three land cover products, whose impact remained comparatively limited across all configurations tested. The authors interpret this as evidence that high-quality polygon-based inventories improve both the robustness and the spatial reliability of landslide susceptibility models.
The comparison suggests that the representation of landslide locations in the training data is a critical, and sometimes underappreciated, determinant of how well susceptibility models perform. Beyond the specific comparison, the study proposes a multiconfiguration framework that separates the effects of inventory representation, land cover data quality, and validation strategy. For hazard mitigation and sustainable land management in mountainous regions, the findings underscore the value of detailed, polygon-based landslide mapping as an input to susceptibility assessment.
The results are specific to the Taslidere Catchment and to shallow translational landslides, and the authors present the framework as a way to clarify the relative influence of inventory representation, land cover data, and validation strategy in machine learning–based landslide susceptibility assessment.
Subject of Research: Machine learning landslide susceptibility mapping in the Taslidere Catchment, Türkiye
Article Title: Influence of landslide inventory representation and land cover configuration on landslide susceptibility mapping: a comparative machine learning analysis from the Taslidere Catchment (Türkiye)
Article References: Ozcan, A. K., & Gokceoglu, C. (2026). Influence of landslide inventory representation and land cover configuration on landslide susceptibility mapping: a comparative machine learning analysis from the Taslidere Catchment (Türkiye). Environmental Monitoring and Assessment, 198(11), Article 1250. https://doi.org/10.1007/s10661-026-16085-4
Image Credits: AI Generated
DOI: 10.1007/s10661-026-16085-4
Keywords: landslide susceptibility, machine learning, landslide inventory, land cover, random forest, extreme gradient boosting, Rize, Türkiye, CORINE, hazard mapping, AUC, environmental monitoring
Cite Scienmag News
Teresa Odom. (October 24, 2026). How Landslide Inventories Are Drawn Shapes Machine Learning Susceptibility Maps. Scienmag. https://scienmag.com/how-landslide-inventories-are-drawn-shapes-machine-learning-susceptibility-maps/
Teresa Odom. "How Landslide Inventories Are Drawn Shapes Machine Learning Susceptibility Maps." Scienmag, 24 October 2026, https://scienmag.com/how-landslide-inventories-are-drawn-shapes-machine-learning-susceptibility-maps/. Accessed 24 October 2026.
Teresa Odom. "How Landslide Inventories Are Drawn Shapes Machine Learning Susceptibility Maps." Scienmag. October 24, 2026. https://scienmag.com/how-landslide-inventories-are-drawn-shapes-machine-learning-susceptibility-maps/


