


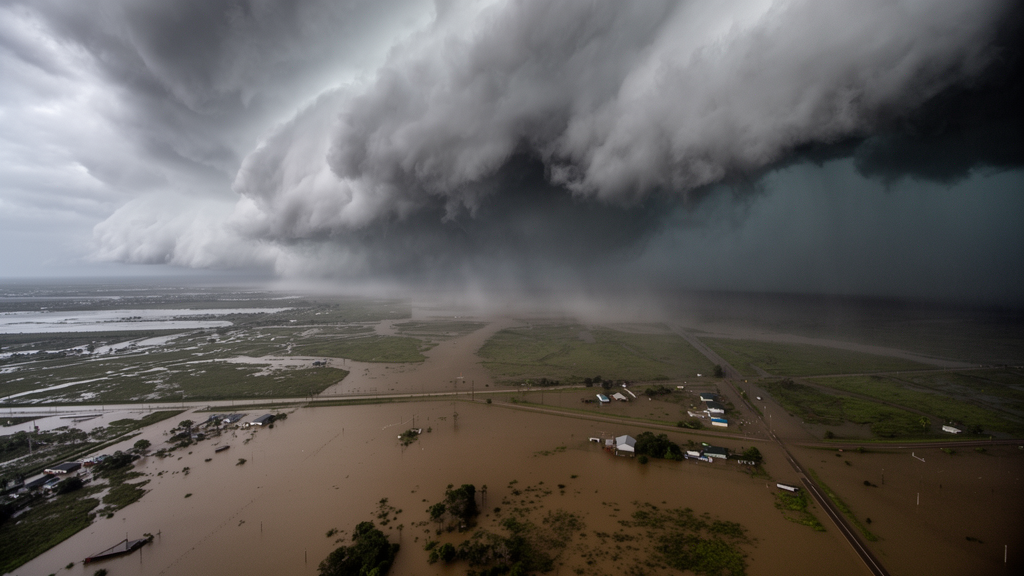
A conventional method used to design flood defenses across the United States may be quietly missing thousands of buildings at risk, according to a new study of the Vermilion River Basin in south-central Louisiana. Researchers at the University of Louisiana at Lafayette’s Louisiana Watershed Flood Center compared the standard engineering approach to extreme rainfall, the so-called design storm, with a more realistic technique that reshuffles actual historical storms across the landscape. The results were striking: even though the conventional storm delivered more total rain, the realistic storm scenarios produced nearly double the estimated structural damage and revealed a hidden inventory of more than 11,000 flooded buildings that the standard method never flagged.
The conventional approach, built on NOAA’s Atlas 14 precipitation-frequency estimates, derives rainfall depths from point-based gauge statistics and then spreads them uniformly across an entire watershed. This practice suppresses the intense spatial organization of real storms, which concentrate torrential rain over small areas while leaving neighboring ground comparatively dry. The alternative technique, known as stochastic storm transposition, or SST, treats historically observed storms as complete space-time rainfall fields that can be repositioned within a broader region of similar extreme-rainfall character. By stochastically relocating full storm fields across a watershed, SST preserves the internal intensity gradients and temporal evolution of real events while exploring many plausible placements relative to the drainage network.
The study focused on the Vermilion River Basin, a roughly 1,500-square-kilometer low-gradient watershed draining into Vermilion Bay and the Gulf of Mexico. The basin collects runoff from a dense network of small tributaries draining urban, suburban, and agricultural land, including the city of Lafayette and surrounding communities. Its main stem is extraordinarily flat, dropping on average only about one foot over every ten river miles. As a result, water levels there are controlled not by a simple upstream-to-downstream gradient but by the spatial interplay of tributary inflows, wetland storage, and coastal water levels, which can even push floodwater in opposite directions during extreme events. The basin contains 173,327 structures cataloged in the National Structure Inventory.
To compare the two rainfall representations, the team defined a 100-year, 24-hour event in two ways. The baseline scenario used the Atlas 14 point depth near the basin centroid, adjusted for basin size using Technical Paper 40 depth-area relationships, yielding 310 millimeters of rainfall distributed uniformly with the peak intensity block centered at the midpoint of the storm duration. The second scenario drew on 50 SST realizations generated with the open-source RainyDay framework from the NCEP Stage IV gauge-adjusted radar rainfall archive covering 2002 to 2020. Parent storms were selected from a catalog of 350 candidate 24-hour events, with 26 discarded for poor radar quality, and the surviving storms were resampled and repositioned within a transposition domain surrounding the basin.
Each rainfall scenario was pushed through the same calibrated, one-way coupled modeling chain developed under the Louisiana Watershed Initiative. A semi-distributed HEC-HMS hydrologic model handled the upstream watershed, discretized into 187 sub-basins and 146 routing reaches, while a two-dimensional HEC-RAS hydrodynamic model simulated inundation across roughly 3,626 square kilometers of floodplain using a rain-on-grid configuration. The terrain model combined high-resolution lidar elevation data with channel bathymetry from sonar surveys, and more than 615 bridges, culverts, and hydraulic structures were explicitly represented. The coupled model was calibrated and validated against eight historical flood events, including Hurricanes Laura and Delta. Performance for water-surface elevation generally exceeded the screening targets, with most events meeting the criteria at 80 to 100 percent of evaluated stage gauges, while discharge performance was more variable because only two discharge gauges exist in the basin, with some discharge metrics meeting the event-level criterion using just one of the two. Identical model parameters and antecedent wetness assumptions were held fixed across all simulations so that differences in outcomes could be attributed to the rainfall forcing alone.
The resulting flood-depth maps were then intersected with building locations and converted to monetary losses using standardized US Army Corps of Engineers depth-damage functions, which translate water depth above a structure’s first-floor elevation into a fraction of its replacement value. The numbers revealed a paradox. The uniform Atlas 14 storm, with its larger basin-average rainfall of 310 millimeters versus a mean of 238.1 millimeters across the SST realizations, produced about USD 0.477 billion in total structure damage, comparable to the 90th-percentile SST composite. Yet the maximum SST composite, labeled SSTmax, produced approximately USD 0.923 billion, nearly twice the baseline estimate. Notably, across the 50 realizations, the rank of basin-average rainfall depth did not closely match the rank of total damage, indicating that where a storm’s intense core lands matters as much as how much rain falls.
The most consequential divergence appeared in the exposure gap between the two methods. A total of 11,518 buildings were inundated in at least one SST realization but not under the Atlas 14 storm, representing more than USD 110 million in cumulative structural damage. The reverse disagreement was small: only 312 buildings flooded under Atlas 14 but not under SSTmax, contributing roughly USD 2 million, with most experiencing water depths of just a few centimeters. The SST-exclusive structures were typically inundated in only one to four of the 50 realizations, and their median flood depths were shallow, between 0.08 and 0.13 meters. The financial significance of this group therefore lies in its sheer size and in a subset of buildings that experienced deeper flooding, rather than in any single dramatic inundation.
Spatial analysis pinpointed exactly where the two approaches disagreed. Kernel density estimation of inundated building locations showed that both methods identified the main low-lying flood-prone regions, but two developed areas, the Lafayette-Scott corridor and the city of Abbeville, exhibited markedly stronger and more concentrated impact clusters under SSTmax. Modeled inundation-depth differences at populated locations in these areas ranged from 0.3 to 0.75 meters, with New Iberia also showing differences of 0.1 to 0.5 meters. A terrain diagnostic called Height Above Nearest Drainage, or HAND, which measures the vertical distance between a location and its nearest drainage channel, explained the pattern. The middle 60 percent of the SST-only divergence was concentrated at HAND values between 10 and 20 meters, intermediate terrain-transition zones where buildings sit close to their inundation thresholds and can be tipped over the edge by localized rainfall cores that a uniform storm never delivers.
The team also tested whether the conventional approach could be rescued by tweaking its assumptions. Simulating the upper bound of the Atlas 14 90 percent confidence interval, 389.3 millimeters after depth-area adjustment, raised total damage to about USD 0.738 billion, while shifting the temporal peak of the storm to 25 or 75 percent of the 24-hour duration produced smaller changes, around USD 0.426 and 0.495 billion respectively. All of these sensitivity cases remained below the SSTmax estimate, suggesting that rainfall-depth uncertainty within the deterministic framework matters, but that no plausible adjustment of a uniform design storm reproduces the upper-envelope losses that emerge when storm placement and spatial variability are represented.
The authors are careful about the scope of their conclusions. The study compares two representations of a single 1 percent annual exceedance probability, 24-hour rainfall event in one basin, and neither captures compound coastal drivers such as storm surge coinciding with rainfall. The SST results also depend on the chosen transposition domain and parent-storm catalog, and the 50 realizations represent a computationally feasible sample rather than an exhaustive exploration of all possible storm placements. The researchers do not argue that Atlas 14 should be abandoned; it remains a standardized, reproducible input for conventional design. Rather, they suggest that where building-level consequences and localized pluvial flooding drive decisions, pairing deterministic design-storm simulations with spatially variable rainfall ensembles can reveal exposure hotspots and damage concentrations that uniform storms systematically miss, information that could reshape mitigation priorities, benefit-cost screening, and drainage investments in flat, developed watersheds like the Vermilion.
Subject of Research: Comparing uniform design storms with stochastic storm transposition for flood exposure and structure damage estimation in south Louisiana
Article Title: Flood exposure and structure damage under deterministic design-storm and stochastic storm transposition rainfall scenarios: a case study in South Louisiana, USA
Article References: ElSaadani, M., Habib, E., & Morsy, M. M. (2026). Flood exposure and structure damage under deterministic design-storm and stochastic storm transposition rainfall scenarios: a case study in South Louisiana, USA. Natural Hazards and Earth System Sciences, 26(10), 5201-5218. https://doi.org/10.5194/nhess-26-5201-2026
Image Credits: AI Generated
DOI: 10.5194/nhess-26-5201-2026
Keywords: flood risk, design storm, stochastic storm transposition, NOAA Atlas 14, Vermilion River Basin, Louisiana, flood damage estimation, HEC-RAS, pluvial flooding, floodplain management, rainfall variability, hydraulic modeling
Cite Scienmag News
Violet Maxwell. (October 23, 2026). Hidden Flood Risk: How Realistic Storm Patterns Nearly Doubled Damage Estimates in Louisiana. Scienmag. https://scienmag.com/hidden-flood-risk-how-realistic-storm-patterns-nearly-doubled-damage-estimates-in-louisiana/
Violet Maxwell. "Hidden Flood Risk: How Realistic Storm Patterns Nearly Doubled Damage Estimates in Louisiana." Scienmag, 23 October 2026, https://scienmag.com/hidden-flood-risk-how-realistic-storm-patterns-nearly-doubled-damage-estimates-in-louisiana/. Accessed 23 October 2026.
Violet Maxwell. "Hidden Flood Risk: How Realistic Storm Patterns Nearly Doubled Damage Estimates in Louisiana." Scienmag. October 23, 2026. https://scienmag.com/hidden-flood-risk-how-realistic-storm-patterns-nearly-doubled-damage-estimates-in-louisiana/


