


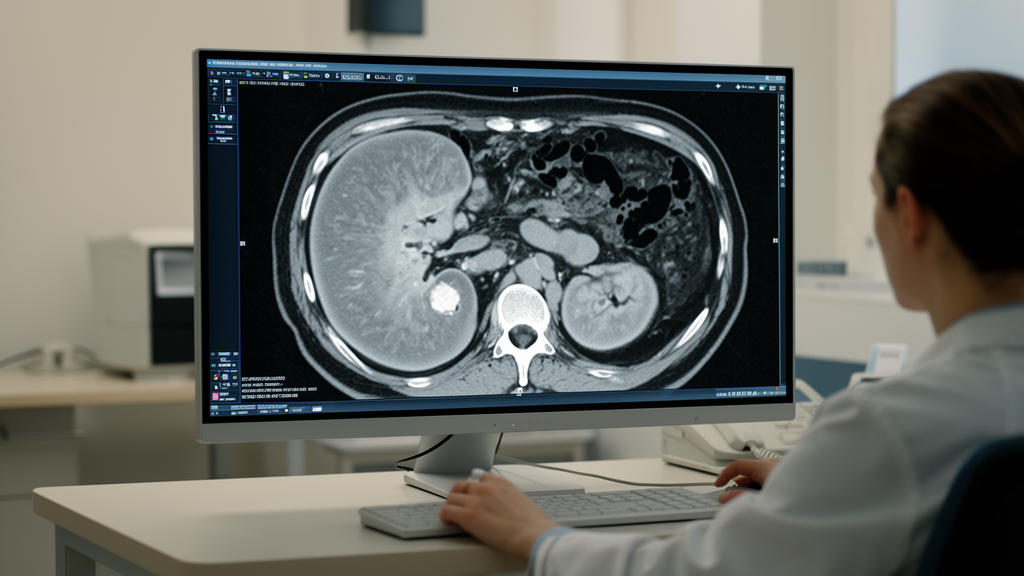
Non-enhanced computed tomography scans revealed that the density of fat surrounding the kidneys differs in specific anatomical locations between people with renal cell carcinoma and healthy controls, according to a retrospective study of 57 patients with histopathologically confirmed cancer and 82 controls. The clearest case-control differences occurred at the upper renal poles: mean perirenal fat density, expressed in Hounsfield units, was more negative in the cancer group on both the right and left sides. Because less-negative values indicate denser tissue, these findings point to a measurable alteration in the environment of some kidney tumors. However, the association disappeared after statistical adjustment for age, which was markedly different between the groups and limits the conclusion.
The investigation focused on perirenal adipose tissue, a visceral fat depot enclosed by Gerota’s fascia and characterized by rich vascularization and immune-cell infiltration. Tissue next to a solid tumor can undergo metabolic and inflammatory remodeling, including changes in adipocytes, extracellular matrix and vascular tissue that may alter its CT attenuation. Adipose tissue is ordinarily associated with negative Hounsfield-unit values, so a shift toward zero can reflect changes in lipid content, fibrosis or inflammation. The researchers examined whether this imaging signal varied with tumor position, size and pathological features, and whether the same measurements could be reproduced with artificial intelligence rather than relying exclusively on hand-selected regions of interest. The goal was quantitative characterization of an imaging marker, not a test of whether perirenal fat changes cause cancer or affect outcomes.
All cancer participants had non-enhanced computed tomography scans obtained between May 2015 and December 2021 at a single Turkish institution. Of 118 consecutive patients initially screened, 61 were excluded because of motion artifacts, technical limitations or inadequate image quality. The final cancer cohort had a mean age of 65.1 years, compared with 50.0 years among controls, a statistically significant difference. Controls were evenly divided between 41 men and 41 women and distributed across age decades from 30 to 69, but the groups as a whole were not age-matched. A senior radiologist reviewed the images and placed ten circular regions of interest per kidney, each measuring 50 to 70 square millimeters, at the upper, middle and lower poles while avoiding vessels, fascia, tumor margins and artifacts. Images were acquired with 1-mm slices on a 128-row multidetector scanner, using tube voltages of 100 to 120 kV and body-mass-index-modulated tube currents.
At the upper poles, mean perirenal fat density was −97.64 ± 10.73 HU on the right in the cancer group, compared with −94.99 ± 9.76 HU in controls, and −100.39 ± 10.20 HU on the left, compared with −96.55 ± 10.57 HU in controls. The corresponding p values were 0.040 and 0.032. No significant case-control differences were detected at either middle or lower pole. Within controls, right and left measurements differed significantly at all three levels, showing that perirenal fat density has a degree of anatomical asymmetry even in people without known renal or systemic disease. In the cancer group, a significant right-left difference was confined to the upper pole, where the p value was 0.005. This side and region dependence means that a single average measurement could obscure differences present in individual anatomical areas.
Tumor geometry helped refine the spatial pattern. When each of the six measurements was classified by its relationship to the tumor, fat directly adjacent to the tumor was denser than fat at non-adjacent poles on the same side, at the matching pole on the opposite side and at non-matching contralateral poles. Mean density was −93.2 ± 11.5 HU adjacent to the tumor, compared with −96.0 ± 16.6 HU in ipsilateral non-adjacent regions, −100.1 ± 7.7 HU in contralateral matched poles and −99.7 ± 8.4 HU in contralateral non-matched poles; paired comparisons gave p = 0.0025, p < 0.0001 and p < 0.0001, respectively. Tumor dimensions were also positively correlated with density in the ipsilateral upper pole, including correlations of 0.284 and 0.369 with total anteroposterior and transverse dimensions. These associations support a localized tumor–fat interaction, but they do not establish that fat-density changes cause tumor growth or invasion.
The upper-pole case-control pattern was not confined to tumors located at the top of the kidney. Among 17 patients with lower-pole tumors, upper-pole fat density was lower than in controls on both sides, with p values of 0.032 and 0.018. Patients with middle-zone tumors did not show the same differences, and comparisons among tumor-location groups within the cancer cohort were not significant. Other findings were similarly selective: density did not differ significantly by sex or between the 41 clear-cell and 12 papillary renal cell carcinomas. The 12 papillary tumors included three WHO/ISUP type 1 and nine type 2 cancers, which were analyzed together because the subtype-specific groups were too small for a reliable comparison. Density also was not significantly associated with lymphovascular invasion, Gerota’s fascia thickening or tumor necrosis, although it was consistently less negative in the 13 lymphovascular-invasion-positive cases.
Larger tumor volume, however, was strongly associated with necrosis. No necrosis was observed among 13 tumors smaller than 17 cc, compared with 11 of 20 tumors in the 40.01–134 cc group and 7 of 13 tumors above 134 cc; Fisher’s exact test gave p = 0.003. Discrimination between cancer and control groups was modest and depended on measurement location. The area under the receiver operating characteristic curve was 0.603, with a 95% confidence interval of 0.505–0.700, for the right upper pole and 0.607, with an interval of 0.511–0.704, for the left upper pole. These were the only regions whose confidence intervals excluded an AUC of 0.5. Values at the right and left middle poles were 0.561 and 0.464, while lower-pole values were 0.416 and 0.444. The design also compared confirmed cancers with healthy controls rather than patients with indeterminate or benign renal masses, so it did not test the discrimination needed to establish clinical diagnostic value.
For automated analysis, the team trained a YOLOv8x segmentation model on 1,637 CT slices from the 139 participants, with about 12 slices per patient spanning the upper, middle and lower kidney regions. A senior radiologist and anatomist manually annotated the left and right perirenal-fat regions. Images were resized to 640 × 640 pixels, and the model was trained for 100 epochs with stochastic gradient descent and a learning rate of 0.01 on an Nvidia A100 graphics processor. Data were divided by patient, rather than by slice, to prevent information leakage between training and evaluation sets, with 70% used for training, 20% for validation and 10% for testing. At the best epoch, precision was 79.6%, recall 78.8% and mean average precision at an intersection-over-union threshold of 0.5 was 82.98%. These metrics describe performance within the study dataset; no external test set or cross-validation was used.
The automated density estimates agreed best with the radiologist’s measurements when the analysis included CT values from −125 to +30 HU. Wider normalization windows produced much lower density estimates: for example, the mean right-upper-pole value in cases was −132.71 ± 3.39 HU with the −150 to −50 HU interval and −162.44 ± 5.41 HU with the −190 to −30 HU interval, compared with −97.64 ± 10.73 HU manually. Even the closest interval produced statistically significant differences in several subgroup-level comparisons, including the left upper pole in both cases and controls. The result shows that an AI segmentation system does not eliminate measurement-definition problems: threshold selection materially changes the derived biomarker. The model also required manually selected and annotated regions during development and validation, and its ability to transfer to different hospitals, scanners and patient populations remains untested.
The largest threat to the headline case-control finding is age. An exploratory multivariable regression accounting for group, age and sex found that the upper-pole difference was no longer significant after age adjustment, with p = 0.51 on the right and p = 0.56 on the left. Age was an independent inverse predictor of density at p < 0.001 for both sides of upper-pole PRFD, but the reported age relationship differed between groups: within controls, age correlated with right upper-pole density at r = −0.535, p < 0.001, whereas the corresponding correlation was not significant within cases at r = −0.038, p = 0.78. The retrospective design, modest sample, single-center setting and small subgroups—including 12 papillary cancers and 13 cancers with lymphovascular invasion—further restrict interpretation. The results identify a spatially heterogeneous imaging feature and a promising computational workflow, but not a clinically validated biomarker for detecting or characterizing renal cell carcinoma.
Subject of Research: Regional CT measurement of perirenal fat density in renal cell carcinoma and automated segmentation with YOLOv8
Article Title: Quantitative assessment of perirenal fat density in renal cell carcinoma: a combined radiologist-driven and YOLO-based CT study
Article References: Sasani, H., Özkan, M., Şimşek, M. A., Akgül, H. M., & İsal Arslan, A. (2026). Quantitative assessment of perirenal fat density in renal cell carcinoma: a combined radiologist-driven and YOLO-based CT study. Frontiers in Radiology, 6, 1911034. https://doi.org/10.3389/fradi.2026.1911034
Image Credits: AI Generated
DOI: 10.3389/fradi.2026.1911034
Keywords: renal cell carcinoma, perirenal fat, computed tomography, Hounsfield units, YOLOv8, medical imaging, image segmentation, age confounding, tumor microenvironment, Quantitative, assessment, perirenal
Cite Scienmag News
Nathaniel Bowman. (October 22, 2026). CT Fat Density Reveals Region-Specific Changes Around Kidney Cancer. Scienmag. https://scienmag.com/ct-fat-density-reveals-region-specific-changes-around-kidney-cancer/
Nathaniel Bowman. "CT Fat Density Reveals Region-Specific Changes Around Kidney Cancer." Scienmag, 22 October 2026, https://scienmag.com/ct-fat-density-reveals-region-specific-changes-around-kidney-cancer/. Accessed 22 October 2026.
Nathaniel Bowman. "CT Fat Density Reveals Region-Specific Changes Around Kidney Cancer." Scienmag. October 22, 2026. https://scienmag.com/ct-fat-density-reveals-region-specific-changes-around-kidney-cancer/


