


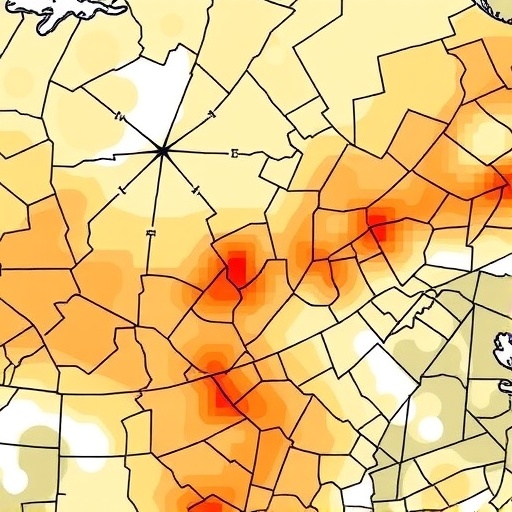
Drought is rarely a single, well-behaved variable. It arrives as a combination of severity, duration and magnitude, and it strikes two reservoirs of water at once: the atmosphere above and the aquifer below. A new study published in Water Resources Management has now taken one of the most detailed statistical looks yet at how uncertain our estimates of these compound droughts really are, and the findings suggest that water managers who rely on a single “best estimate” drought frequency curve may be dramatically overconfident in their planning.
The research, led by Zohreh Pakdaman of the Department of Statistics at the University of Hormozgan in Iran, together with Ommolbanin Bazrafshan of the University of Hormozgan’s Faculty of Agricultural and Natural Resources, Sajad Jamshidi of Purdue University and Reza Alizade Noughabi of the University of Hormozgan, focuses on a class of statistical tools known as copulas. Copulas, first formalized by Abe Sklar in 1959, are mathematical functions that couple univariate marginal distributions into a joint multivariate distribution, allowing analysts to model the dependence structure between variables without making assumptions about their individual behaviors. In drought hydrology, this is indispensable, because drought severity, duration and magnitude are strongly interdependent: long droughts tend to be severe, and severe droughts tend to deplete groundwater in ways that reinforce their own meteorological drivers.
The team constructed a composite meteo–groundwater drought index, blending signals from precipitation deficits and groundwater levels rather than treating these domains separately. This is a deliberate departure from the classic standardized precipitation index introduced by McKee and colleagues in 1993, which captures only the atmospheric side of drought. Groundwater responds to drought with its own lagged, damped dynamics, as Bloomfield and Marchant demonstrated when they extended the standardized index framework to groundwater levels. By merging meteorological and hydrogeological information, the new index reflects the reality that a community’s water security depends on both the rain that fails to fall and the aquifer reserves that quietly shrink beneath it. Three different derivation approaches were used to build this composite index, allowing the researchers to test how sensitive their conclusions were to the way the index itself was constructed.
From this foundation, the authors delineated what they call severity–duration–magnitude–frequency, or SDMF, curves. These are the drought equivalent of the rainfall intensity–duration–frequency curves that civil engineers use to design drainage systems: for a given conditional probability, the curves describe how severe a drought of a given duration and magnitude is expected to be. The conditional probability framework is the key technical innovation here. Rather than asking only how likely a drought of certain characteristics is in an unconditional sense, the analysis asks: given that a drought has already lasted a certain duration and reached a certain magnitude, how severe is it likely to become? This conditional perspective directly serves disaster preparedness, because it speaks to the question a water manager actually faces mid-crisis, when the drought is already underway and the future trajectory is uncertain.
Three copula estimation methods were compared head-to-head: the Maximum Entropy (ME) approach, the Empirical (EM) method, and Maximum Likelihood Estimation (MLE). The maximum entropy approach, rooted in the work of Kapur and of Zellner and Highfield, constructs the copula by finding the distribution that satisfies known constraints while introducing the fewest spurious assumptions, a principle that Aghakouchak and later Shekari, Zamani and Bazrafshan brought into bivariate drought analysis. The empirical method relies directly on observed rank data, while maximum likelihood fits parametric copula families by optimizing the joint likelihood of the observed drought events. The comparison produced a clear intensity ranking: MLE yielded conditional probability estimates indicating more intense droughts than EM, which in turn slightly exceeded ME, while ME and EM produced strikingly similar results across scenarios.
The dependence structure itself was well captured by the normal copula, which effectively represented the regional relationships among severity, duration and magnitude. This is a meaningful finding for practitioners, because copula selection is a known weak point in multivariate hydrological analysis; choosing the wrong dependence structure can bias return period estimates substantially, as studies of tail dependence by Nguyen and Jayakumar have shown. That a tractable, symmetric copula family performed well for this arid-region composite index offers a practical template for other water-stressed basins.
The heart of the study, however, is uncertainty quantification, an area the authors note has received limited attention despite its importance. Two distinct sources of uncertainty were dissected. The first is sampling variability: because the historical record contains only a finite number of drought events, the empirical sample of droughts is itself a random draw from a larger hypothetical population of possible droughts. The second is copula parameter uncertainty: even given the true sample, the parameters that define the copula’s dependence structure can only be estimated, not known exactly. Using bootstrap resampling, a technique introduced by Efron and surveyed by Tibshirani and Efron, the team generated many resampled versions of the drought record and refit the copulas repeatedly, building probability distributions around every point on the SDMF curves.
The results carry a sobering message. Both uncertainty sources visibly distort the conditional probability isolines, the contour lines of equal drought likelihood on the severity–duration–magnitude surface. Yet their influence is not uniform. The effects of both sampling variability and parameter estimation uncertainty shrink consistently as the conditional probability decreases, meaning that estimates of extreme conditional drought outcomes are, in relative terms, more tightly constrained than those of moderate ones. Conversely, the uncertainty band around the SDMF curves widens as drought magnitude increases: the larger and more consequential the drought being planned for, the fuzzier the statistical picture becomes. This creates an uncomfortable asymmetry for infrastructure planners, who must design reservoirs, wells and emergency supplies against precisely those high-magnitude events where the statistical uncertainty is greatest.
Method choice mattered too, but in a structured way. Uncertainty under the maximum likelihood method exceeded that under the empirical and maximum entropy approaches, while ME and EM again showed strong agreement with each other. The authors attribute part of the maximum entropy method’s appeal to its flexibility in combining different marginal distributions, which frees the analyst from forcing rainfall and groundwater data, whose statistical shapes differ considerably, into a single parametric family. Perhaps the most consequential single finding is the comparison between the two uncertainty sources: the uncertainty associated with the sampling variability of drought events has a greater impact on the SDMF curves than the uncertainty arising from copula parameter estimation itself. In other words, even a perfect dependence model cannot rescue an analysis built on a short, sparse record of observed droughts. Lengthening observational records, and potentially pooling regional information, may matter more than refining the statistical machinery applied to them.
The study was conducted with an eye toward practical application in arid regions, drawing on regional water management experience including assessments of artificial recharge effects on the Shamil–Ashkara aquifer. The authors argue that multivariate drought frequency analysis, when honest about its uncertainties, becomes more valuable, not less, for water managers and disaster preparedness programs. Instead of a single line on a map promising a once-in-fifty-years drought, the uncertainty bands provide decision-makers with a range of plausible futures at each drought severity level, enabling risk-tiered responses: robust actions that perform well across the entire uncertainty range for moderate droughts, and adaptive, monitoring-heavy strategies for the high-magnitude events where the bands widen.
The work also situates itself within a rapidly growing literature on multivariate drought risk. Recent studies have applied copula-based severity–area–frequency analysis in China’s Heihe River basin, quantified hydrological drought uncertainties in the Weihe River, developed joint drought indices combining the standardized precipitation index with the evaporative demand drought index for climate change applications, and coupled vine copulas with conditional quantile regression for agricultural drought prediction. Related work in the same journal has compared maximum entropy copulas with traditional copula models for joint flood simulation, suggesting that the entropy framework’s advantages extend across the water hazard spectrum. What distinguishes the new study is its systematic, three-method, two-source dissection of uncertainty in a compound meteorological–groundwater context, an area where most prior analyses have offered only point estimates.
As climate change intensifies hydrological variability in arid and semi-arid regions, and as groundwater-dependent communities face mounting stress on their aquifers, the gap between statistical elegance and operational reality narrows in importance. This study demonstrates that the gap can be measured, bounded and, to a meaningful degree, managed. The authors received no external funding for the work and declare no competing interests. The data underlying the analysis are available from the researchers on request. For the growing community of hydrologists and water managers confronting drought under deep uncertainty, the message is clear: the curves they consult should come with bands around them, and the longest possible drought record is the most valuable data investment they can make.
Cite Scienmag News
Violet Maxwell. (September 6, 2026). Copula Methods Quantify Uncertainties in Drought Analysis. Scienmag. https://scienmag.com/copula-methods-quantify-uncertainties-in-drought-analysis/
Violet Maxwell. "Copula Methods Quantify Uncertainties in Drought Analysis." Scienmag, 6 September 2026, https://scienmag.com/copula-methods-quantify-uncertainties-in-drought-analysis/. Accessed 6 September 2026.
Violet Maxwell. "Copula Methods Quantify Uncertainties in Drought Analysis." Scienmag. September 6, 2026. https://scienmag.com/copula-methods-quantify-uncertainties-in-drought-analysis/


