


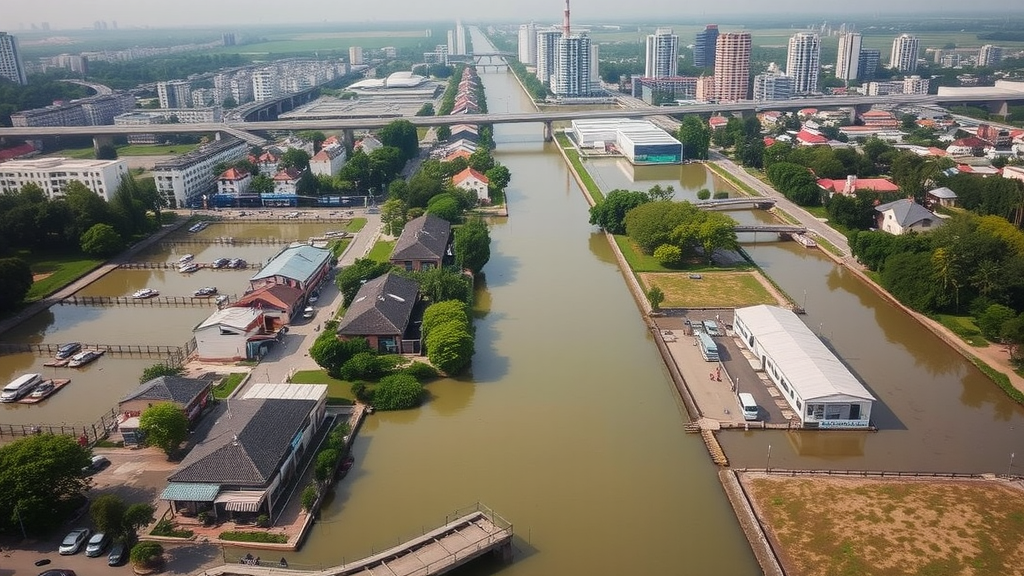
In the sprawling port city of Chattogram, Bangladesh, thousands of urban ponds quietly serve as lifelines for washing, irrigation, livestock watering and local biodiversity. Yet a new city-wide investigation suggests many of these water bodies are under far greater strain than previously understood. Researchers from Port City International University, Chittagong University of Engineering and Technology and Dhaka University of Engineering and Technology have completed what they describe as the first comprehensive, ward-by-ward diagnostic of pond water quality across all 41 administrative wards of the Chattogram City Corporation, and their results paint a picture of a city divided between relatively clean peripheral waters and severely degraded central and southern hotspots.
The study, published in the journal Discover Cities, sampled one representative pond in each of the 41 wards during August and September 2025, targeting the largest and most frequently used pond in each ward to ensure comparability. Water was collected in sterilized two-liter bottles, chilled to 4 degrees Celsius and transported for laboratory analysis of seven key parameters: pH, dissolved oxygen, biochemical oxygen demand, total dissolved solids, nitrate-nitrogen, phosphate-phosphorus and fecal coliform. All measurements were conducted in triplicate with calibrated instruments and standard quality-control procedures, including blanks, duplicates and standard checks, using facilities at Port City International University and fecal coliform analysis at the Bangladesh Council of Scientific and Industrial Research laboratory.
The measured ranges tell a story of sharp spatial variability. Dissolved oxygen, a fundamental indicator of aquatic health, fluctuated between 2.1 and 6.3 milligrams per liter, with many wards falling below the 5 milligrams per liter benchmark set by Bangladesh’s environment regulations. Biochemical oxygen demand, which tracks the oxygen consumed by microbes decomposing organic waste, ranged from 1.2 to 12.4 milligrams per liter, with the most contaminated readings concentrated in wards 17, 21 and 28. Nutrient levels remained moderate by comparison, with nitrate-nitrogen spanning 0.3 to 4.8 milligrams per liter and phosphate-phosphorus from 0.12 to 1.42 milligrams per liter, though phosphate exceeded national standards on average, pointing toward sewage leakage and runoff as persistent sources.
To translate these raw numbers into something city planners can act upon, the team computed a Water Quality Index for every ward using the weighted arithmetic mean method, a widely applied approach that distills multiple parameters into a single score. The resulting values spanned an extraordinary range, from roughly 12, indicating excellent conditions, to 390, signaling severe pollution. The most degraded wards, including wards 2, 7, 21, 24, 32 and 41, combined high biochemical oxygen demand, elevated phosphate and depressed dissolved oxygen. In contrast, wards 8, 16, 19, 25, 28, 30, 33, 34, 35 and 40 recorded comparatively low index values, with adequate oxygen, neutral pH and low dissolved solids, marking them as the city’s cleanest pond systems.
When the index values were mapped geographically using inverse distance weighting interpolation in ArcGIS 10.8, a clear spatial pattern emerged. Water quality deteriorated toward the southwestern and central portions of the city, while the northern periphery, dominated by forest cover and larger natural water bodies, retained the best conditions. The researchers supplemented the mapping with a 2024 land use and land cover classification derived from satellite imagery, dividing the city into built-up areas, agricultural land, forest and vegetation, water bodies and bare soil. Wards surrounded by agriculture or transitional urban sprawl showed elevated pollution loads, whereas wards with dense vegetative buffers and natural dilution capacity fared markedly better, reinforcing the link between land management and water health.
The statistical backbone of the study came from Pearson correlation analysis and principal component analysis, both applied after Shapiro-Wilk tests confirmed approximate normality of the data. The correlation matrix produced one striking result: dissolved oxygen and biochemical oxygen demand correlated at r = 0.99, an association so strong that the authors caution it partly reflects the shared five-day incubation measurement basis of the two parameters rather than a purely independent environmental relationship. More telling was the inverse relationship between dissolved oxygen and fecal coliform, with a correlation coefficient of -0.96, indicating that microbial contamination and oxygen depletion travel together, a signature of organic and sewage-driven pollution. Nutrients, pH and dissolved solids showed only weak, non-significant correlations, suggesting they were secondary stressors in this setting.
Principal component analysis compressed the seven parameters into interpretable axes of variation. The first component accounted for 43.63 percent of total variance and was dominated by dissolved oxygen, biochemical oxygen demand, total dissolved solids, nitrate and phosphate, effectively representing the overall pollution load. The second component, explaining 17.25 percent, captured a nutrient and acidity gradient centered on pH and nitrate-nitrogen. Together the first two components explained 60.88 percent of the variance, with a third adding 14.05 percent. Sampling adequacy checks supported the analysis overall, with a Kaiser-Meyer-Olkin measure of 0.695 and a significant Bartlett’s test, though pH and phosphate showed weak individual adequacy. The biplot confirmed that sites separated primarily along the pollution-load axis, with fecal coliform contributing additional variation along the second component.
Placed in regional context, Chattogram’s ponds occupy an intermediate position on a South Asian degradation continuum. The authors compared their findings with studies from Savar in Bangladesh, where pond water recorded dissolved oxygen as low as 1.1 milligrams per liter and fecal coliform counts reaching 2.9 times 10 to the fourth colony-forming units per milliliter, and from Chhattisgarh in India, where pond pH ranged from 6.23 to an extreme 13.30. At the other end of the spectrum, urban ponds in Lisbon, Portugal maintained healthy oxygen levels of 6.8 to 10.7 milligrams per liter despite elevated nutrient loads. Chattogram’s waters, the study concludes, are more organically stressed than Lisbon’s but less chemically extreme than the most degraded South Asian comparators, with fecal coliform and nitrate-nitrogen largely within safe limits but phosphate and biochemical oxygen demand exceeding national standards.
The public health implications are direct. Where ponds continue to be used for washing, bathing or small-scale irrigation, the co-occurrence of elevated biochemical oxygen demand, phosphate and fecal coliform constitutes a plausible exposure pathway for gastrointestinal illness, while nutrient and organic loading drive the eutrophication that degrades aquatic ecosystems. The authors frame their index values not as abstract statistics but as proxies for real community exposure, and they note that a ward-resolved vulnerability map of this kind gives the Chattogram City Corporation a practical screening tool for prioritizing drainage and sanitation investments, in line with Sustainable Development Goal 6 on clean water and sanitation and Goal 11 on sustainable cities.
The team is candid about the limitations of their baseline. Sampling was conducted once, in the early post-monsoon season, from a single pond per ward, so seasonal fluctuations between pre-monsoon and post-monsoon conditions remain unmeasured, and the interpolated pollution surface should be read as an indicative screening product rather than a precise prediction. Machine learning models, increasingly common in water quality forecasting, were deliberately excluded from this first baseline but form the basis of an ongoing follow-up study aiming to predict index values and classify pollution status across the city’s wards. Even so, the integrated framework of index calculation, correlation analysis, component analysis and geographic information system mapping offers a replicable template for other rapidly urbanizing South Asian cities that lack ward-level water quality data, and it establishes a reference point against which future restoration efforts in Chattogram can be measured.
Subject of Research: Ward-level spatial assessment of urban pond water quality in Chattogram City, Bangladesh, using physicochemical, microbial, statistical and GIS-based methods
Article Title: Spatial distribution and statistical evaluation of pond water quality across 41 wards in Chattogram City, Bangladesh
Article References: Aziz, M. A., joya, S. A., Salam, J. U., Maruf, M. M. H., & Haque, A. (2026). Spatial distribution and statistical evaluation of pond water quality across 41 wards in Chattogram City, Bangladesh. Discover Cities, 3(1), Article 176. https://doi.org/10.1007/s44327-026-00362-5
Image Credits: AI Generated
DOI: 10.1007/s44327-026-00362-5
Keywords: water quality, urban ponds, Chattogram, Bangladesh, Water Quality Index, dissolved oxygen, biochemical oxygen demand, fecal coliform, principal component analysis, GIS mapping, land use, urban pollution
Cite Scienmag News
Courtney Benton. (September 23, 2026). Chattogram’s Ponds Reveal Stark Pollution Divide Across 41 Urban Wards. Scienmag. https://scienmag.com/chattograms-ponds-reveal-stark-pollution-divide-across-41-urban-wards/
Courtney Benton. "Chattogram’s Ponds Reveal Stark Pollution Divide Across 41 Urban Wards." Scienmag, 23 September 2026, https://scienmag.com/chattograms-ponds-reveal-stark-pollution-divide-across-41-urban-wards/. Accessed 5 October 2026.
Courtney Benton. "Chattogram’s Ponds Reveal Stark Pollution Divide Across 41 Urban Wards." Scienmag. September 23, 2026. https://scienmag.com/chattograms-ponds-reveal-stark-pollution-divide-across-41-urban-wards/


