


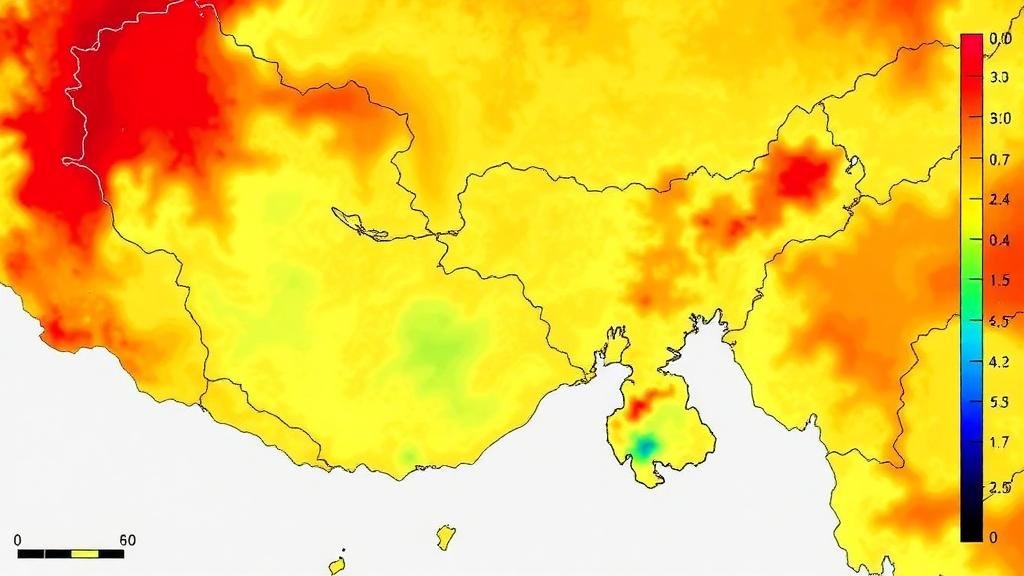
Odisha, the eastern Indian state wedged between the Bay of Bengal and a vast inland landmass, has long been synonymous with heat. Now a new study has subjected its temperature extremes to one of the most statistically rigorous treatments yet, using Bayesian extreme-value theory to estimate how rare thermal events behave across the state’s individual grid cells. The research, published in Discover Geoscience, analysed more than seven decades of quality-controlled meteorological data to produce uncertainty-aware estimates of 10-, 20- and 50-year return levels for hot days, warm nights and cold nights, and the results challenge the assumption that a warming climate pushes every kind of temperature extreme in the same direction.
The study, led by Tapas Ranjan Patra of Rajendra University with colleagues from Utkal University and Netaji Subhash Chandra Bose College, drew on daily maximum and minimum temperature records from the India Meteorological Department’s gridded archive covering 1951 to 2024. Rather than averaging the state into a single number, the team preserved spatial detail by working at the 1-degree by 1-degree grid-cell scale. Of 30 grid cells overlapping Odisha’s boundary, 28 had complete enough records to enter the modelling stage, a 93.3 percent spatial coverage that allowed coastal, interior and transitional zones to be assessed within one common framework.
The statistical engine of the study was the generalized extreme value distribution, the standard tool for modelling the tails of annual or seasonal maxima and minima. For each grid cell and each extreme series, the researchers fitted five nested candidate models: a stationary model with a fixed location parameter, a model in which the location shifts linearly through time, and three models that added the El Niño-Southern Oscillation index, the Indian Ocean Dipole index, or both as covariates. Bayesian inference, implemented in PyMC with four Hamiltonian Monte Carlo chains and strict convergence diagnostics, propagated uncertainty from parameter estimation all the way through to the return-level estimates, producing posterior intervals rather than single point values.
Diagnostic discipline was central to the workflow. A fit was deemed clean only if it showed finite parameters, a maximum R-hat of 1.01 or less, effective sample sizes of at least 400, zero divergences and no support violations. Among clean candidates, the model with the highest expected log predictive density was preferred, with a parsimony rule favouring simpler structures when candidates competed within two ELPD units. The team completed 767 fits in total, including rescue refits for difficult cases, and every one of the 140 selected grid-series combinations ultimately yielded numerically valid return levels, with five cold-night cases retained under explicit model cautions.
One of the clearest findings concerns the timing of daytime heat. The annual maximum daily maximum temperature and the March-to-June maximum proved almost indistinguishable: they shared the same mean of 41.4 degrees Celsius, the same median, and the same observed range from roughly 35 to 46.4 degrees. In 99.95 percent of valid grid-years, the annual extreme fell within the extended pre-monsoon heat season. This confirms that Odisha’s hottest days are not scattered through the year but concentrated in a well-defined window when high insolation, dry soils and anticyclonic circulation combine to push daytime temperatures toward their limits.
The headline number for heat planners is the recent 50-year return level for pre-monsoon daytime maxima: a spatial median of 43.81 degrees Celsius, with grid-level medians spanning 41.60 to 46.52 degrees. Yet the study is careful about what its zero-change results mean. In 27 of 28 grids, the selected model was stationary, which by construction forces the early-to-recent return-level change to be exactly zero. The authors stress that these zeros are structural properties of the chosen models, not independent evidence that daytime heat has stopped evolving. A separate sensitivity analysis that imposed a time trend uniformly across grids found small positive changes in daytime extremes, though none large enough for the 95 percent credible intervals to exclude zero.
The warm-night story turned out to be strikingly different. Night-time extremes showed much stronger support for time-varying models, and the direction of change was negative: recent return levels for monsoon-season warm-night maxima were lower than early-period values, with the median 50-year return level falling from 30.82 to 30.35 degrees Celsius. In a sensitivity restricted to data through 2007, negative time coefficients persisted in every eligible grid, 12 of 12 for annual warm nights and 19 of 19 for monsoon-season warm nights. The authors caution that this does not mean Odisha is cooling; rather, it reflects seasonally specific behaviour of upper-tail minimum temperatures, consistent with earlier evidence of negative monsoon-season minimum-temperature trends over eastern India, possibly linked to cloud cover, humidity and land-sea influences.
Cold-night extremes in winter behaved differently again, with near-zero and mixed changes and return levels that were more sensitive to how boundary grid cells were handled. Meanwhile, teleconnection covariates earned only a limited role. ENSO appeared in 16 selected models, the Indian Ocean Dipole in 9, and both together in just 6, out of 140 selections, and their coefficient evidence was mixed rather than uniformly directional. The authors interpret this cautiously: large-scale climate modes may modulate Odisha’s extremes only in specific grid cells and seasons, and the data did not justify a state-wide teleconnection narrative.
What emerges is a portrait of thermal risk that refuses to be flattened into a single warming trend. Daytime heat remains anchored in the pre-monsoon season at physically consequential magnitudes, warm-night tails behave according to their own seasonal logic, and cold nights show little coherent change. The authors emphasize that their return levels are conditional summaries of observed tail behaviour, not deterministic forecasts of events arriving once every 50 calendar years. They also note the limits of 1-degree gridded data for urban or district-scale planning, and the fact that their models were fitted independently rather than through a spatial hierarchy.
Even with those caveats, the study offers something regional planners rarely get: a defensible, uncertainty-bounded benchmark of how rare hot days, warm nights and cold nights have actually behaved across Odisha’s landscape. The authors suggest that future work could add spatial hierarchical modelling, compare these observational benchmarks with CMIP6 and CORDEX projections, and test physically grounded covariates such as soil moisture, monsoon onset and humidity-linked heat stress. For a state where heatwaves correlate significantly with recorded mortality, knowing the magnitude and uncertainty of the rarest thermal events, grid cell by grid cell, is a practical foundation for the climate-risk decisions that lie ahead.
Subject of Research: Bayesian extreme-value assessment of observed temperature extremes and return levels across Odisha, India
Article Title: Bayesian assessment of return levels for observed temperature extremes across Odisha in India
Article References: Bayesian assessment of return levels for observed temperature extremes across Odisha in India. (n.d.). https://doi.org/10.1007/s44288-026-00777-y
Image Credits: AI Generated
DOI: 10.1007/s44288-026-00777-y
Keywords: Bayesian inference, extreme value theory, generalized extreme value distribution, temperature extremes, return levels, Odisha, India, heatwaves, ENSO, Indian Ocean Dipole, climate risk, IMD gridded data
Cite Scienmag News
Violet Maxwell. (October 14, 2026). Bayesian Extreme-Value Analysis Maps Rare Temperature Extremes Across Odisha. Scienmag. https://scienmag.com/bayesian-extreme-value-analysis-maps-rare-temperature-extremes-across-odisha/
Violet Maxwell. "Bayesian Extreme-Value Analysis Maps Rare Temperature Extremes Across Odisha." Scienmag, 14 October 2026, https://scienmag.com/bayesian-extreme-value-analysis-maps-rare-temperature-extremes-across-odisha/. Accessed 14 October 2026.
Violet Maxwell. "Bayesian Extreme-Value Analysis Maps Rare Temperature Extremes Across Odisha." Scienmag. October 14, 2026. https://scienmag.com/bayesian-extreme-value-analysis-maps-rare-temperature-extremes-across-odisha/


