


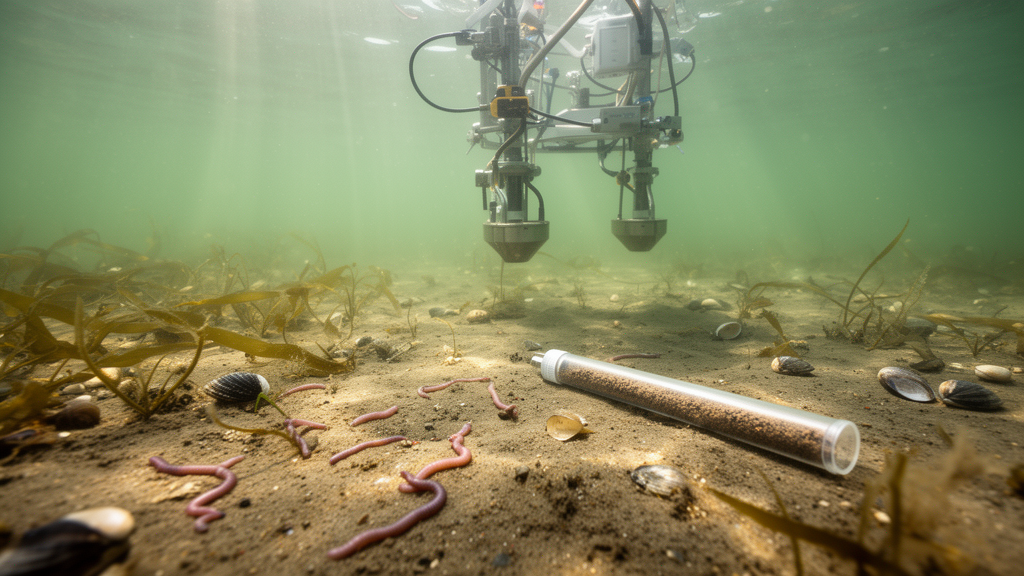
A comparative study of Baltic Sea meiofauna found that the genetic marker used strongly affected diversity estimates, while community composition differed between the Fehmarn Belt and Oderbank regions. The study sampled sediments in proposed marine protected areas and adjacent reference areas before bottom-trawl exclusion was introduced, providing a baseline for future assessments rather than measuring the effect of a trawling ban.
Researchers analyzed 50 sediment samples collected in two research cruises: 24 from the Fehmarn Belt in May and early June 2020 and 26 from Oderbank in June 2021. The Fehmarn Belt samples included 12 replicates from marine protected areas and 12 from reference areas; Oderbank included 17 protected-area replicates and nine reference-area replicates. The upper five centimetres of sediment and overlying water were collected with a multicorer, preserved in DESS and processed for DNA metabarcoding.
Two gene regions were amplified and sequenced: the mitochondrial cytochrome c oxidase subunit I marker, COI, and the V1–V2 region of nuclear 18S ribosomal DNA. Sequencing produced approximately 19 million paired-end reads. The researchers retained sequence variants assigned to major meiofaunal groups, including nematodes, copepods, flatworms, mites, ostracods, kinorhynchs, gastrotrichs and tardigrades, and clustered variants into operational taxonomic units at a 3% similarity threshold. They also compared species-level harpacticoid copepod identifications from microscopy with detections from both markers.
The 18S V1–V2 marker recovered substantially more meiofaunal diversity than COI. It yielded 2,946 amplicon sequence variants clustered into 1,425 OTUs, compared with 1,108 variants and 312 OTUs for COI. Nematodes were the most diverse group in the 18S dataset, with 868 OTUs, followed by flatworms with 242 and copepods with 110. COI detected only 79 nematode OTUs, while mites were better represented by COI, with 57 OTUs compared with 29 for 18S. OTU richness, Shannon diversity and Pielou’s evenness were all higher with 18S in Wilcoxon rank-sum tests, with p-values below 2×10⁻¹⁶ and large effect sizes for richness (Cohen’s d = −5.6), Shannon diversity (d = −4.77) and evenness (d = −2.92).
Because the broader 18S coverage was considered more suitable for community-wide comparisons, the spatial analyses used V1–V2 data. Community composition differed significantly between the Fehmarn Belt and Oderbank, with a PERMANOVA p-value of 0.001, and non-metric multidimensional scaling separated samples from the two regions. Protected and reference areas also differed significantly at Oderbank (p = 0.001), but not in the Fehmarn Belt (p = 0.146). Environmental conditions differed substantially between regions: Fehmarn Belt sediments contained about 50% particles smaller than 62.5 micrometres, compared with about 0.5% at Oderbank, and had higher organic-matter content and salinity. The authors therefore regarded the Oderbank difference as likely reflecting natural spatial patchiness, because trawling exclusion had not yet been implemented when the samples were collected.
The harpacticoid comparison showed that morphology and the two molecular methods captured partly different assemblages. In the Fehmarn Belt, microscopy produced the highest median richness per sample, followed by COI and 18S. At Oderbank, both molecular methods slightly exceeded morphology. COI shared 24 OTUs or species with morphology, whereas 18S shared six. The methods also detected unique taxa: 18S recorded 67, COI 35 and morphology 22. Similarity was highest between COI and morphology, with a Sørensen index of 0.517 and Jaccard index of 0.348, compared with lower overlap between 18S and the other approaches. Thirteen of the 20 most frequently detected harpacticoid taxa were observed by all three methods.
Both approaches nevertheless contributed information that the other missed. Microscopy identified some rare or undescribed copepods, including Normanella obscura and Monopenicillus anke, that were absent from one or both molecular datasets. The molecular analyses detected OTUs that could represent cryptic lineages or juvenile stages, including within Cletodes tenuipes, Nannopus palustris, Pseudobradya and Parabradya dilatata. Some species were associated with multiple OTUs, possibly because non-adult stages were difficult to identify microscopically and lacked suitable reference barcodes, leading sequence assignments to the closest related database species.
These observations define the study as a pre-exclusion baseline survey with limited geographic and temporal scope. Sampling covered two Baltic regions in different years, with proposed rather than fully implemented protected areas, and used sequencing reads as a proxy for relative abundance rather than a direct measure of organism numbers. Reference-database gaps, primer bias, incomplete sampling saturation for 18S and difficulties identifying juvenile harpacticoids also constrain comparisons. The dataset can therefore support before-after-control-impact comparisons of the trawling exclusion, but it does not by itself demonstrate that exclusion improves meiofaunal diversity.
Subject of Research: Baseline comparison of Baltic Sea meiofauna diversity using metabarcoding and morphology before bottom-trawl exclusion.
Article Title: Baseline studies on meiofauna in the Baltic Sea before bottom-trawl fisheries exclusion II. A comparative study using multi-gene metabarcoding and morphology
Article References: Khodami, S., Ostmann, A., Packmor, J., George, K. H., & Martínez Arbizu, P. (2025). Baseline studies on meiofauna in the Baltic Sea before bottom-trawl fisheries exclusion II. A comparative study using multi-gene metabarcoding and morphology. Metabarcoding and Metagenomics, 9, Article e169630. https://doi.org/10.3897/mbmg.9.169630
Image Credits: AI Generated
Keywords: Baltic Sea, meiofauna, metabarcoding, 18S rDNA, COI, harpacticoid copepods, marine protected areas, biodiversity monitoring, bottom trawling, morphological identification, Baseline, studies
Cite Scienmag News
Margaret Porter. (October 20, 2026). Baseline Baltic Sea meiofauna survey finds marker and location shape biodiversity estimates. Scienmag. https://scienmag.com/baseline-baltic-sea-meiofauna-survey-finds-marker-and-location-shape-biodiversity-estimates/
Margaret Porter. "Baseline Baltic Sea meiofauna survey finds marker and location shape biodiversity estimates." Scienmag, 20 October 2026, https://scienmag.com/baseline-baltic-sea-meiofauna-survey-finds-marker-and-location-shape-biodiversity-estimates/. Accessed 20 October 2026.
Margaret Porter. "Baseline Baltic Sea meiofauna survey finds marker and location shape biodiversity estimates." Scienmag. October 20, 2026. https://scienmag.com/baseline-baltic-sea-meiofauna-survey-finds-marker-and-location-shape-biodiversity-estimates/


