


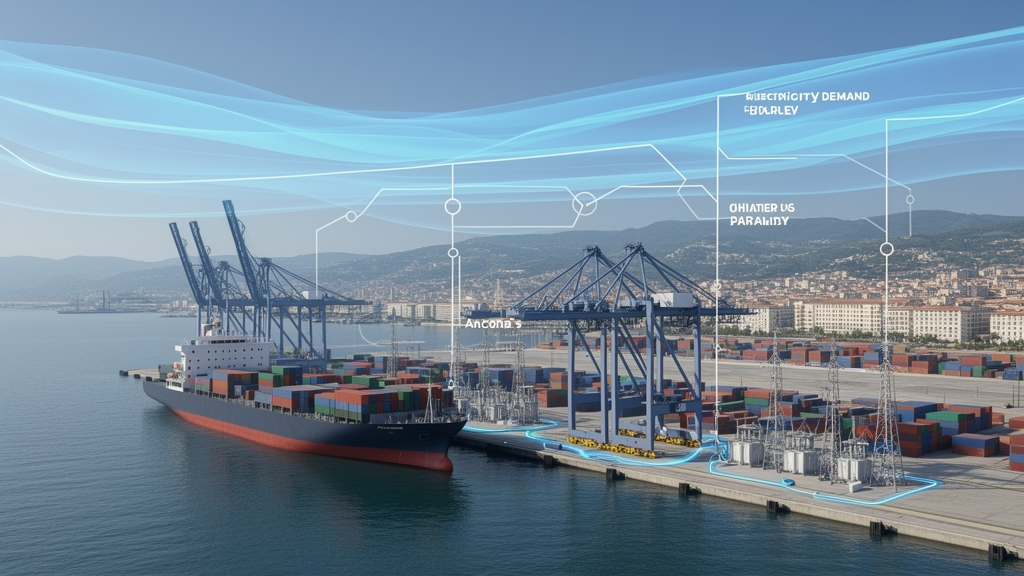
A one-year modelling study of the Port of Ancona found that an autoregressive forecasting system could estimate hourly cold-ironing demand and support a probabilistic approach to shore-power infrastructure sizing. In the study, sizing equipment for the 95th percentile of predicted demand rather than the annual maximum would reduce required installed capacity by 44.9%. The estimate applies to a reconstructed load profile for one Mediterranean port and still requires confirmation with metered shore-power consumption, additional years of traffic and validation at ports with different operating patterns.
The case study focused on an Adriatic-Ionian port whose traffic is dominated by Ro-Pax and passenger ferries serving Greece and Croatia. Its existing static facility consumption, including lighting, terminal buildings, cranes and offices, was approximately 1.2 GWh per year, whereas potential cold-ironing demand was estimated at 52.2 GWh per year. The reconstructed profile had an absolute peak of 26.3 MW, a peak-to-average ratio of 4.42 and a load factor of 22.6%. Demand stayed below 10 MW during more than 80% of operating hours, while loads above 25 MW clustered on high-season Fridays and weekends. The resulting mismatch—equipment capable of handling several large vessels simultaneously but needed during fewer than 5% of the year—made static peak-based planning a central target of the analysis.
Researchers reconstructed the cold-ironing profile from vessel arrival and departure logs, berth-occupancy schedules and technical specifications supplied by the Port Authority. For each hour, a vessel’s rated auxiliary power was multiplied by a type-specific load factor of 0.60–0.80, with 0.70 used nominally, and by a binary indicator of whether the vessel was at berth. Service craft were assigned 1–2 MW, Ro-Ro and container vessels 2–8 MW, and cruise or large container vessels 8–20 MW or more. Arrival and departure timestamps carried an estimated uncertainty of about plus or minus one hour, which the hourly model time step was intended to absorb. The virtual model makes the calculation reproducible, but its absolute magnitude remains an estimate because onboard loads can change with refrigeration, heating, ventilation, cargo handling and other shipboard operations.
The forecasting system was designed as a “Digital Shadow,” an open-loop model that receives information from the physical port without sending control commands back to it. Its data covered all 8,784 hours of leap year 2024 and included 55 candidate exogenous variables from NASA POWER, the Copernicus Climate Data Store, vessel records and other sources. Missing values, affecting less than 0.3% of records, were filled by median imputation fitted on the training partition alone. Sine and cosine transformations represented hour and month without imposing artificial boundaries, while feature selection reduced the static input set to 18 variables and the autoregressive set to 19. This arrangement separated present conditions from recent demand history and allowed the researchers to test how much forecasting skill came from each source.
The central comparison was between a static architecture and a nonlinear autoregressive model with exogenous inputs, or NARX. The static model used weather, calendar and vessel information without knowing recent demand. NARX added three lagged demand measures: power in the preceding hour, the mean demand over the preceding 24 hours and the standard deviation over those 24 hours. All lag features were strictly shifted to prevent future information from entering the training process. Thirteen learners were tested under each architecture, including a 100-tree Random Forest, XGBoost with 100 boosting rounds and a multilayer perceptron with two hidden layers of 100 and 50 neurons. The data were divided chronologically into 80% training and 20% testing portions without shuffling, preserving the sequence of port operations.
The best one-step-ahead result came from the NARX multilayer perceptron, which explained 85.1% of test-set variance. Its root mean squared error was 1,788 kW, its mean absolute error was 1,158 kW and its train–test R² gap was 0.037. The same network using only static features reached R² = 0.562 and RMSE = 3,104 kW. Adding autoregressive memory therefore increased R² by 0.289, while adding exogenous variables to the three lag features improved it by a further 0.032. The three lagged measures alone achieved R² = 0.819, showing that recent demand supplied most of the predictive signal. On the same test partition, the NARX network also performed better than SARIMA at R² = 0.839, persistence at 0.813, a 24-hour-window LSTM at 0.772 and a temporal convolutional network at 0.634.
Two explainability methods helped identify the model’s principal inputs. Under SHAP and permutation analysis, previous-hour demand was the strongest predictor, with a permutation importance of 0.826 for the multilayer perceptron: shuffling that single feature destroyed more than 82% of its predictive capacity. Measures of Ro-Ro cargo ship count and total ship count were the leading external predictors, while a cyclical hour-of-day variable captured the recurring rhythm of ferry arrivals. Climate variables supplied useful but secondary information. The pattern is consistent with a ship remaining connected for several consecutive hours and supports the study’s decision to model cold-ironing and ordinary facility consumption separately, because the study found their predictive structures to differ. It does not establish that climate has no effect on operations; rather, the results show that vessel traffic and temporal persistence carried more forecasting weight in this dataset.
Accuracy declined when forecasts were made recursively, with each predicted value feeding into the next step instead of being replaced by observed demand. R² fell to 0.607 over 24 hours and 0.578 over 48 hours, although both remained above the calendar-naive baselines. A conformal prediction interval constructed from out-of-fold residuals achieved 95.4% empirical coverage and had a mean width of 7,668 kW. Statistical audits found significant residual bias, autocorrelation and heteroscedasticity, while errors were concentrated in June through August and Friday–Saturday evenings, when clustered ferry arrivals made demand more volatile. Mean absolute error exceeded 2,500 kW in the highest-demand quintile but remained below 25% in relative terms. The model tended to underestimate extreme peaks, a direction the authors regarded as conservative for infrastructure planning, while the interval’s upper bound captured additional uncertainty around those events.
Applying the forecasts to infrastructure sizing produced the principal planning result. A conventional approach would dimension equipment for the absolute 26.27 MW maximum, a level reached during 440 hours, or 5.0% of the 8,784-hour year. The 95th-percentile design was 14.47 MW, producing a 44.9% reduction in required installed capacity, while a 99th-percentile design of 18.84 MW produced a 28.3% reduction. Using an explicitly indicative unit-cost band of €0.5–1.5 million per MW for grid-side shore-power capacity, the 11.8 MW difference corresponded to potential savings of €5.9–17.7 million. This was not a complete project estimate: the reported saving did not include exceedance-risk costs, storage or curtailment, and a full techno-economic assessment was left for a companion study. The percentile approach also assumes that demand exceeding design capacity can be managed through forecast-informed connection scheduling, which may be difficult where ferry timetables and berth priorities are rigid.
Sensitivity analysis indicated that the capacity-reduction ratio was unchanged when the assumed auxiliary load factor varied from 0.60 to 0.80, because uniform scaling did not alter the shape of the demand distribution. Under that range, the 95th-percentile design moved from 12.4 to 16.5 MW, while the indicative saving at €1 million per MW ranged from €10.1 million to €13.5 million. The framework is computationally lightweight: the reported model set could train in minutes on a standard workstation, making periodic retraining feasible. Its broader value is methodological, converting cold-ironing demand from a fixed design assumption into a forecast with explained predictors and quantified uncertainty. Before wider deployment, however, the approach needs metered shore-power data, multiple years of traffic, cross-port testing and a fuller economic assessment of reliability, storage and other flexibility mechanisms.
Subject of Research: Machine-learning forecasting of port cold-ironing demand for probabilistic shore-power infrastructure sizing
Article Title: Predictive cold-ironing infrastructure planning for nearly zero-energy ports: A NARX digital-shadow forecasting framework
Article References: Sifakis, N., Cholidis, D., & Arampatzis, G. (2026). Predictive cold-ironing infrastructure planning for nearly zero-energy ports: A NARX digital-shadow forecasting framework. Energy Reports, 16, Article 109801. https://doi.org/10.1016/j.egyr.2026.109801
Image Credits: AI Generated
DOI: 10.1016/j.egyr.2026.109801
Keywords: cold ironing, port electrification, onshore power supply, demand forecasting, machine learning, NARX, infrastructure planning, grid capacity, Digital Shadow, Port of Ancona, Predictive, cold-ironing
Cite Scienmag News
Sloane Callahan. (October 20, 2026). Ancona cold-ironing model links hourly forecasts to 44.9% capacity reduction. Scienmag. https://scienmag.com/ancona-cold-ironing-model-links-hourly-forecasts-to-44-9-capacity-reduction/
Sloane Callahan. "Ancona cold-ironing model links hourly forecasts to 44.9% capacity reduction." Scienmag, 20 October 2026, https://scienmag.com/ancona-cold-ironing-model-links-hourly-forecasts-to-44-9-capacity-reduction/. Accessed 20 October 2026.
Sloane Callahan. "Ancona cold-ironing model links hourly forecasts to 44.9% capacity reduction." Scienmag. October 20, 2026. https://scienmag.com/ancona-cold-ironing-model-links-hourly-forecasts-to-44-9-capacity-reduction/


