


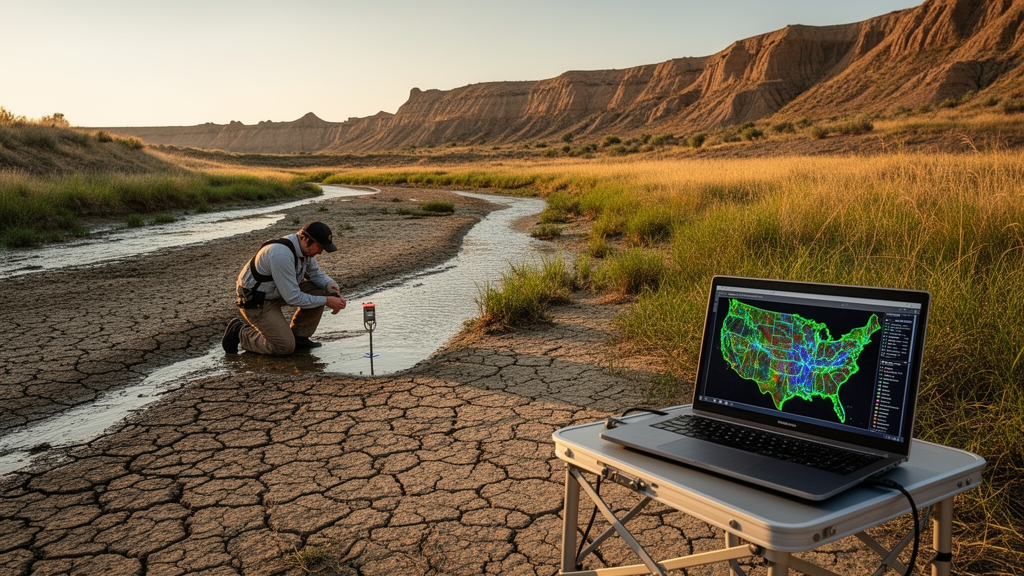
Drought is the natural disaster that touches more people than any other, and in the United States its fingerprints are everywhere: the 2010–2013 southern drought, the 2012–2013 North American event that stretched into Canada and Mexico, and the 2012–2014 California drought that cost billions of dollars. Yet predicting when a river will actually run low remains one of hydrology’s hardest problems, because a drought that begins in the atmosphere must travel through soils, snowpack, vegetation, and groundwater before it finally shows up in a stream. A team of U.S. Geological Survey scientists led by Aaron Heldmyer has now attacked that problem at continental scale, training 3,198 machine learning models—one for every monitored watershed in the conterminous United States—to determine what drives streamflow drought in each region and to demonstrate a new way of predicting droughts in basins where no streamflow data exist at all.
The study, published in Hydrology and Earth System Sciences, relies on daily streamflow records from 1982 to 2020 at USGS gauges compiled in the GAGES-II dataset. After filtering for data completeness—requiring at least eight years of observations per decade with 95 percent of days recorded—the team settled on 3,198 gauges. To define drought objectively, they converted each day’s flow into a percentile using the Weibull plotting position, computed within a 30-day window centered on that calendar day across all years. That trick removes the seasonal cycle, so drought becomes any departure from what a river normally does at that time of year. Anything below the 20th percentile was flagged as drought, a threshold chosen to balance a usable definition against enough events to train a statistical model. Zero-flow days, common in arid and intermittent streams, were handled with a combined threshold-level and continuous-dry-period method that ranks consecutive dry days rather than treating them as ties.
For each gauge, the researchers built a random forest classifier fed with 130 candidate predictors: precipitation, soil moisture at multiple depths, potential evapotranspiration, snow water equivalent, temperature, the Standardized Precipitation Evapotranspiration Index, large-scale climate teleconnections such as El Niño–Southern Oscillation, the Pacific Decadal Oscillation, the Atlantic Multidecadal Oscillation, and the Pacific–North American pattern, plus even sunspot counts. Crucially, each variable entered the model in several forms—raw values, percentile-transformed values, and rolling averages over 30, 90, and 365 days—so the forests could learn which timescales of antecedent conditions matter most. Random forests were chosen for their resistance to overfitting, their tolerance of correlated predictors, and their built-in variable importance scores, which formed the analytical heart of the study. Models were trained on 1985–2015 and tested on the bookend periods 1982–1984 and 2016–2020, and scored with Cohen’s Kappa, a metric robust to the severe class imbalance created when drought occupies only 20 percent of the record.
The single most influential predictor nationwide turned out to be soil moisture at 40–100 centimeters depth, followed by soil moisture at 10–40 centimeters, then a trio of precipitation variables smoothed over 90 and 365 days and the 90-day SPEI. Nothing else came close. But the real story lay in the geography. Potential evapotranspiration dominated in the South, Southwest, and Southeast; snow water equivalent mattered most in the Southwest, Northern Rocky Mountains, Northwest, and West; and the teleconnection indices, while weak at individual gauges, carried outsized weight across the western half of the country. Deep soil moisture was especially important in humid regions, which the authors attribute to hydrologic memory: deficits stored deep in the soil profile sustain low flows long after a passing rainstorm has improved surface conditions, resisting rapid drought recovery.
To transform thousands of gauge-level importance scores into a coherent national picture, the team applied principal component analysis, compressing 130 variables into 27 components that together explained 95 percent of the variance. The first three components told most of the story. The first aligned teleconnections, temperature, and evaporative demand—a cluster centered on the West, Southwest, and Northern Rockies, and notably the same regions where the at-site models performed worst, largely because water management alters flows in ways the data cannot capture. The second component was a moisture axis pitting long-term soil moisture against short-term precipitation, cleanly dividing the humid East from the arid West. The third distinguished snow-driven basins in the mountains and northern latitudes from baseflow-driven, soil-moisture-dominated systems in the South and Southeast, drawing the map along the line between seasonal snowpack storage and subsurface storage.
The regressions linking these components to static basin characteristics revealed why certain regions respond to certain drivers. Basins where teleconnections and temperature loomed large tended to be warmer, rainier, forested or cultivated, and equipped with permeable soils but limited buffering capacity—meaning they lack the soil or snow storage to insulate streamflow from large-scale climate swings. Basins scoring high on the snow-and-soil-moisture component were characterized by high elevation, a large fraction of precipitation falling as snow, and cold freeze timing, consistent with evidence that earlier, slower snowmelt reduces streamflow production. In effect, the study shows that a basin’s physiography—its soils, topography, land cover, and snow regime—determines which meteorological levers can push it into drought, and how hard those levers must be pulled.
The second half of the study tackles a long-standing gap: roughly one-fifth of the nation’s land area drains through watersheds too small, too high, or too remote to appear in the gauge network, and the gaps are not randomly distributed. The team’s solution is a novel dynamic regionalization scheme built on donor gauges. For any hypothetical ungauged location, principal component scores are estimated from its physical characteristics using regressions trained on the 1,900 gauges whose models passed a Kappa threshold of 0.4. Each candidate donor is then scored by how closely its component profile matches the target, weighted by the variance each component explains. The 19 most similar donors—regardless of whether they sit across the country or across the county—are enlisted, their random forest models run on the target’s climate data, and their drought probability predictions averaged and thresholded at 0.35 to yield a final daily drought forecast.
The results were striking: donor-based predictions achieved a mean Kappa of 0.40 across all sites, only 0.02 below the at-site models trained locally on that same gauge’s own data. Even more intriguingly, the ensemble sometimes outperformed the local models, particularly where those models were weak—likely because averaging 19 similar gauges suppresses the noise that a single model overfits. Two worked examples illustrate the method’s flexibility. For Brodhead Creek in Pennsylvania, the selected donors averaged just 219 kilometers away and agreed tightly in their predictions. For the Gunnison River in Colorado, the nearest characteristic donors sat an average of 2,891 kilometers away and disagreed more, yet the ensemble still matched the local model’s accuracy almost exactly. Similarity, not proximity, is what counts.
Beyond its practical value for water managers, the framework offers a partial answer to the black-box criticism that haunts machine learning in high-stakes applications. Because the workflow is compartmentalized—drought definition, random forest training, dimensionality reduction, donor regression, ensemble prediction—a modeler can inspect and adjust each stage, swapping donor sets and observing how predictions change to gauge each donor’s influence. The authors note that tools such as partial dependence analysis or SHAP values could further disentangle the overlapping drivers, especially in the West, where multiple drought typologies stack on top of one another, and they caution that a season-specific modeling approach could better separate snowmelt deficits in spring from evaporative-demand-driven drought in late summer.
The timing of such a tool could hardly be better. Under continued warming, rising evaporative demand and shrinking snowpack are expected to amplify the importance of temperature and energy-balance drivers in the West and Northern Rockies, while shifting precipitation seasonality could redraw the driver map in the East. The drought typology established here provides a baseline against which those future shifts can be measured—and, because the donor method needs no local streamflow record, it extends early-warning capability to the small headwater basins and high-elevation catchments that supply so much of the nation’s water but that gauges have long overlooked.
Subject of Research: Machine learning prediction of streamflow drought and its meteorological drivers across the conterminous United States
Article Title: Predicting streamflow drought in the conterminous United States using machine learning and a donor-gage approach, 1982–2020
Article References: Heldmyer, A., Sando, R., Simeone, C., Wieczorek, M., Hamshaw, S., Goodling, P., McShane, R., Diaz, J., Watkins, D., Pulver, B., Shastry, A., Hafen, K., & Hammond, J. (2026). Predicting streamflow drought in the conterminous United States using machine learning and a donor-gage approach, 1982–2020. Hydrology and Earth System Sciences, 30(18), 5925-5945. https://doi.org/10.5194/hess-30-5925-2026
Image Credits: AI Generated
DOI: 10.5194/hess-30-5925-2026
Keywords: streamflow drought, machine learning, random forest, hydrology, donor gage, ungauged basins, snow water equivalent, soil moisture, teleconnections, USGS, drought prediction, principal component analysis
Cite Scienmag News
Violet Maxwell. (October 9, 2026). AI Learns Where U.S. Streamflow Droughts Come From—and Predicts Them Where No Gauges Exist. Scienmag. https://scienmag.com/ai-learns-where-u-s-streamflow-droughts-come-from-and-predicts-them-where-no-gauges-exist/
Violet Maxwell. "AI Learns Where U.S. Streamflow Droughts Come From—and Predicts Them Where No Gauges Exist." Scienmag, 9 October 2026, https://scienmag.com/ai-learns-where-u-s-streamflow-droughts-come-from-and-predicts-them-where-no-gauges-exist/. Accessed 9 October 2026.
Violet Maxwell. "AI Learns Where U.S. Streamflow Droughts Come From—and Predicts Them Where No Gauges Exist." Scienmag. October 9, 2026. https://scienmag.com/ai-learns-where-u-s-streamflow-droughts-come-from-and-predicts-them-where-no-gauges-exist/


