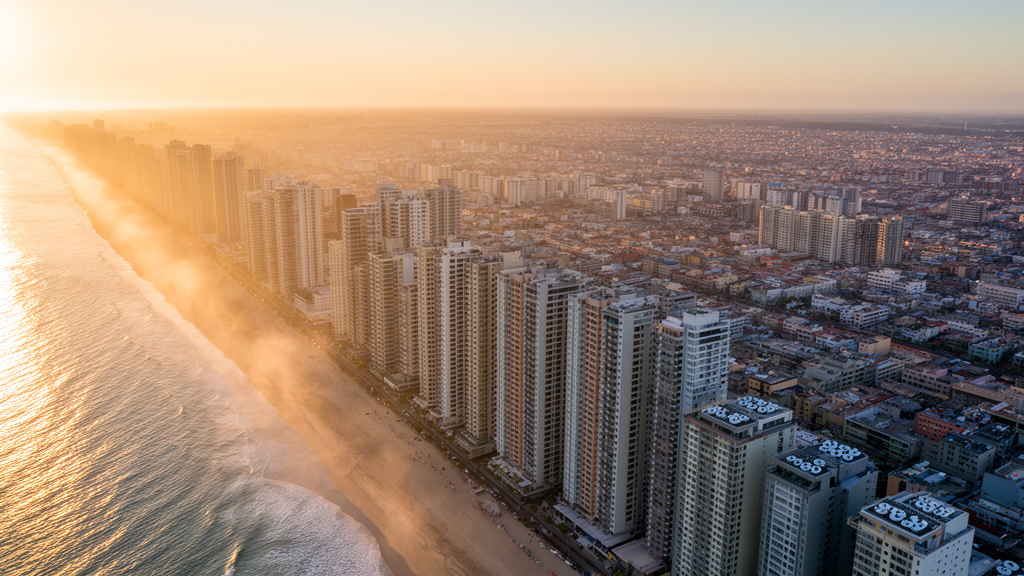
In the coastal Chinese city of Qingdao, the distance between a building and the shoreline may quietly decide how much electricity its air conditioners burn each summer. A new simulation study published in the journal City and Built Environment examined neighborhoods spaced along an 80-kilometer transect running inland from the Yellow Sea coast and found that annual cooling energy consumption rises in a nonlinear pattern with distance from the water, with the sharpest changes occurring within roughly 60 kilometers of the shoreline. Buildings closest to the coast fared best, benefiting from lower summer temperatures and the moderating influence of sea breezes.
The research, led by Yifan Guan and Xi Meng, set out to address a stubborn blind spot in building energy simulation. Most existing studies feed their models a single Typical Meteorological Year file, effectively assuming that the climate is identical across an entire city. That assumption of spatial homogeneity works poorly in coastal settings, where land-sea interactions create stable and continuous gradients in air temperature, humidity and wind speed. Neglecting these localized microclimate variations, the authors note, can produce systematic discrepancies between simulated outcomes and actual operational energy expenditure, potentially misleading energy planning, design optimization and retrofitting strategies.
Qingdao offered an ideal testing ground. Situated on the south-eastern Shandong Peninsula, the city backs onto mountains and faces the sea along a long, indented coastline, under the influence of a maritime monsoon climate. To isolate the effect of distance from the water, the team first quantified the city’s urban texture. Using 2024 cadastral data, they divided Qingdao into blocks, screened out parcels that were too small, too elongated, sparsely built or dominated by open space, and identified 1,495 valid study blocks. Seventeen morphological parameters known to relate to microclimate were calculated for each block using ArcGIS Pro.
A k-means clustering method built on principal component analysis then grouped the blocks into six microclimate sub-regions, with the optimal cluster number determined through Silhouette scores and Gap statistics. Among these, open low-rise areas, which account for 21.34 percent of the sampled blocks, emerged as the typical and representative block type. All subsequent analysis was restricted to this single morphology to eliminate the confounding influence of differing land surface form. Distance buffer zones were constructed at 0, 20, 40, 60 and 80 kilometers from the main coastline, a range chosen because sea breezes typically penetrate 10 to 100 kilometers inland and because 80 kilometers spans most of Qingdao’s neighborhoods. Strict latitude limits were imposed on candidate areas to avoid differences in solar radiation and macro-climate, and one representative block was selected from each gradient.
Because no actual weather stations continuously covered the five sampling points, the researchers turned to the high-resolution ERA5 atmospheric reanalysis dataset, using spatial interpolation to derive hourly meteorological data for each location. To ensure the resulting weather files were climatically representative rather than skewed by an extreme year, they drew on historical data spanning 2005 to 2024 and applied the Finkelstein-Schafer statistical method to construct Typical Meteorological Years in EnergyPlus Weather format. These location-specific files were then coupled to the EnergyPlus building energy simulation platform.
The reference building was a two-storey office block of 640 square meters, matching the 1-to-3-storey character of open low-rise districts. Its envelope thermal performance followed the provisions for cold-region Zone B in China’s Energy Conservation Design Standard for Public Buildings, covering U-values for external walls, roof and glazing. Operating conditions reflected a typical office: occupant density of one person per 10 square meters, lighting power density of 9 watts per square meter, equipment loads of 15 watts per square meter, HVAC running from 08:00 to 18:00 on working days, and a cooling season indoor setpoint of 26 degrees Celsius.
The microclimate data revealed a striking stratification. The node nearest the coastline recorded the lowest peak temperature, 33.42 degrees Celsius, with the smallest diurnal variation, while peak temperatures climbed steadily inland to a maximum of 37.23 degrees Celsius at the 80-kilometer node, a peak difference of 3.8 degrees. Solar radiation stayed relatively consistent across nodes, but wind patterns diverged sharply: the coastal site, directly exposed to sea-breeze circulation, showed the highest wind speeds with a median near 5.73 meters per second, declining to roughly 4.52 meters per second inland as surface roughness increased and sea-breeze penetration weakened. Relative humidity followed an opposite exponential decay, averaging above 70 percent in the coastal zone and falling to 65 percent at 80 kilometers inland. This inverse coupling, where temperature rises with distance while humidity falls, defines the distinctive environmental boundary condition for coastal buildings.
Simulation results translated these gradients into energy terms. On a typical summer design day, peak cooling loads were 99.32 watts per square meter at the coastal node, rising to 101.13 watts per square meter at 80 kilometers inland, meaning sea breezes shave roughly 1.82 percent off peak loads during the hottest periods. A nonlinear regression of cooling load per unit area against distance yielded a coefficient of determination of 0.98, confirming a significant positive correlation. More consequentially for annual budgets, buildings within the 0-to-20-kilometer zone consumed 11.91 percent less total cooling energy than those in the 60-kilometer zone, and the regression curve showed its steepest slope within the first 40 kilometers. Interestingly, although relative humidity declines inland, latent heat load did not fall; it remained relatively stable due to compensating effects of rising temperature and changing wind speed, while the growth in sensible heat load became the dominant driver of the total increase.
A Pearson correlation analysis reinforced the mechanism. Distance from the coast correlated significantly and positively with dry-bulb temperature and negatively with relative humidity, quantifying the ocean’s cooling-and-humidifying regulation. Sensible heat load tracked ambient temperature strongly, whereas latent heat load responded jointly to humidity, temperature and wind speed. Total cooling energy consumption correlated significantly and positively with distance, temperature and sensible heat load, indicating that fluctuations in sensible load driven by the spatial attenuation of air temperature are the core determinant of cooling energy demand in Qingdao’s coastal microclimate. In the discussion, the authors report that annual sensible heat load of coastal buildings is approximately 19.38 percent lower than that of inland buildings, and that energy consumption at 80 kilometers is 11.69 percent higher than at the shoreline, leading them to describe the coastline as a significant natural resource for net energy savings.
The authors are careful to flag the study’s boundaries. Only a single standard low-rise office building was modeled, so results cannot be directly extrapolated to residential or commercial stock with different internal gains and schedules. Urban morphology was held static to isolate the distance variable, ignoring the dynamic urban heat island effect across the 80-kilometer span; in reality, high-density inland districts generate their own heat and roughness that impede sea-breeze penetration, a synergistic thermal penalty that could push actual inland cooling loads above the baseline simulation values. The study also covers summer cooling in a typical monsoon climate zone only, leaving the ocean’s winter heat-source effect unexplored. Even so, the findings carry a practical message: coastal metropolitan zoning and building energy efficiency standards should incorporate distance-based microclimate correction factors, particularly within the 40-kilometer sensitive buffer, to avoid overestimating cooling loads near the shore and to steer climate-adaptive design in the world’s rapidly growing coastal cities.
Subject of Research: The influence of distance from the coastline on building cooling energy consumption in Qingdao
Article Title: The impact of distance from the coastline on building energy consumption: a simulation study based on microclimate in Qingdao
Article References: Guan, Y., & Meng, X. (2026). The impact of distance from the coastline on building energy consumption: a simulation study based on microclimate in Qingdao. City and Built Environment, 4(1), Article 11. https://doi.org/10.1007/s44213-026-00077-8
Image Credits: AI Generated
DOI: 10.1007/s44213-026-00077-8
Keywords: building energy consumption, coastal microclimate, sea breeze, Qingdao, EnergyPlus simulation, cooling load, urban heat island, typical meteorological year, humidity, climate-adaptive design, impact, distance
Cite Scienmag News
Denise Maddox. (October 29, 2026). How Far From the Sea You Build Changes Cooling Energy Demand. Scienmag. https://scienmag.com/how-far-from-the-sea-you-build-changes-cooling-energy-demand/
Denise Maddox. "How Far From the Sea You Build Changes Cooling Energy Demand." Scienmag, 29 October 2026, https://scienmag.com/how-far-from-the-sea-you-build-changes-cooling-energy-demand/. Accessed 30 October 2026.
Denise Maddox. "How Far From the Sea You Build Changes Cooling Energy Demand." Scienmag. October 29, 2026. https://scienmag.com/how-far-from-the-sea-you-build-changes-cooling-energy-demand/