Engineers in China have built a full-length digital twin of a 29.588-kilometer tourism highway, put 50 people behind the wheel of an immersive driving simulator, and measured their bodies’ responses kilometer by kilometer. The study, published in Discover Artificial Intelligence, describes a framework that fuses Building Information Modeling (BIM), geographic data, drone photogrammetry, and physiological monitoring to evaluate road design before a single meter of asphalt is laid. The results show that driver stress is not scattered randomly along a scenic route but clusters tightly at predictable places: sharp curves and tunnel entrances.
The motivation for the work lies in a long-standing weakness of tourism highway evaluation. These roads are meant to do more than move traffic; they carry aesthetic landscaping, ecological goals, and regional cultural identity, connecting cities to scenic areas. Yet their design quality has traditionally been judged after construction, through expert site visits or static visual surveys. Such methods cover only short observation windows, cover limited stretches of road, and cannot capture how a driver’s perception shifts continuously while moving at speed. Repeating them is costly, and comparing results across different projects is difficult because judgments rest largely on subjective expert opinion.
To close that gap, the research team reconstructed the Jinan S103 Tourism Road in Shandong Province, the primary corridor linking Jinan to its southern mountains. The digital twin was assembled from several data streams. Oblique photogrammetry flown with a DJI Matrice 300 RTK drone at a 4-centimeter ground sampling distance produced a high-density reality mesh of the surrounding mountains and water bodies, covering 300 meters on each side of the corridor. Infrastructure, including three major viaducts, one tunnel, 12 culverts, service areas, and non-motorized lanes, was modeled parametrically in BIM. A Dynamo visual programming workflow automatically parsed structural parameters such as span lengths, pier elevations, and pavement widths from the original design documents, generating components with centimeter-level geometric accuracy.
All of the heterogeneous data, from BIM components to the photogrammetric mesh, were registered to the China Geodetic Coordinate System 2000 and imported into Unreal Engine 5 through the Datasmith plugin. The team applied level-of-detail adjustment, occlusion culling, hybrid lighting, and texture and normal mapping to keep real-time rendering above 60 frames per second across the long corridor. Auxiliary structures such as viewing pavilions and rest stops were modeled in SketchUp purely for visual fidelity rather than structural analysis. The researchers also designed an Internet of Things mapping layer through which roadside sensors could eventually stream live traffic and geometric data into the twin, though no physical sensors were installed for this experiment; dynamic effects were simulated with predefined environmental parameters instead.
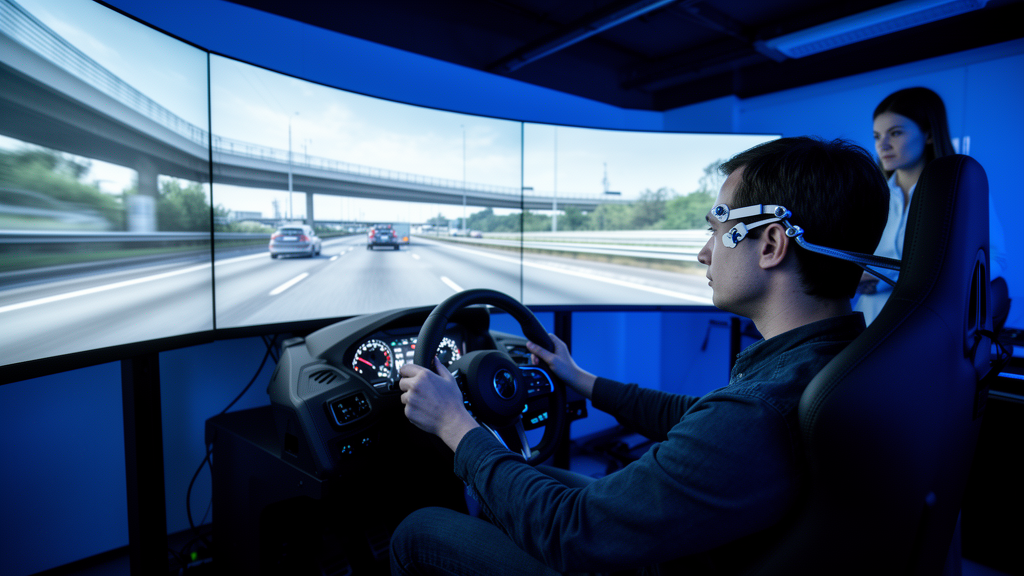
The driving platform itself combined a Logitech simulator with force-feedback steering, a triple-screen display spanning roughly 150 degrees of horizontal field of view, and Unreal Engine 5 vehicle dynamics configured for a 1,500-kilogram sedan with a 2.7-meter wheelbase. Three expert drivers calibrated the model against published field measurements until the root-mean-square error of simulated yaw rate and lateral acceleration fell below 5 percent. Each participant drove the entire corridor under three weather scenarios, clear, moderate rain, and dusk, with the presentation order counterbalanced using a Latin square design. Meanwhile, a wearable biosensor recorded heart rate, heart rate variability, and electrodermal activity, and the simulator logged speed, steering, pedal positions, and lane offset at 30 hertz, all synchronized to virtual GPS coordinates along the route.
The 50 participants, 26 men and 24 women aged 23 to 45 with at least three years of licensed driving, came from three professional backgrounds: landscape designers, transportation researchers, and construction engineers. A power analysis indicated the sample was more than sufficient, with observed power above 0.99 for the key heart rate variability finding. Four indicators formed the core of the evaluation. Heart rate variability, computed as the standard deviation of normal-to-normal heartbeat intervals in rolling five-minute windows, indexed the autonomic nervous system’s adaptability. A composite stress score combined normalized heart rate variability and skin conductance level. Skin conductance itself captured moment-to-moment emotional arousal, and the standard deviation of operating speed reflected driving stability.
The physiological data told a strikingly spatial story. Repeated-measures ANOVA revealed a significant effect of segment type on the heart rate variability ratio, which fell to 0.86 on curved sections and 0.81 in the tunnel compared with 0.94 on straight sections, with medium-to-large effect sizes. Stress ratios rose to 1.18 on curves and 1.27 in the tunnel against 1.03 on straights, and peak skin conductance climbed to 1.32 and 1.45 respectively. Notably, weather made no significant difference to any of these measures, suggesting that road geometry outweighs moderate atmospheric variation in shaping driver workload. When the team mapped the responses along the mileage axis, high-workload zones concentrated in three hotspot regions: chainages K12+300 to K14+100, K21+400 to K23+800, and the tunnel entrance and exit zones, with elevated stress episodes largely overlapping the low-HRV hotspots.
Speed variability added an individual dimension. The average across all drivers was 4.17 kilometers per hour, but three participants exceeded the 90th percentile threshold of 7.2 kilometers per hour, and excluding them lowered the group average to 3.86. A linear mixed-effects model showed that sharper curve radii were significantly associated with greater speed fluctuation, and that segments with panoramic lookouts also produced significantly higher speed variability, consistent with drivers adjusting pace as attractive scenery approached. Weather and noise barrier type, by contrast, showed no significant effect; even the difference between brick-wall and landscape-painting barriers was statistically indistinguishable.
The authors argue that the framework’s value lies in shifting evaluation to the pre-construction stage, pinpointing problematic sections by exact mileage, and enabling quantitative comparison of design alternatives, since separate virtual scenes can be tested with identical participant groups. The spatial hot-spot maps translate directly into design actions: enlarging curve radii where heart rate variability collapses, alternating open viewing corridors with sparse green belts to break up monotonous vegetation, standardizing the spacing of viewing decks and signage, and simplifying information density in stress-concentrated zones. The workflow ran stably throughout the experiment, with all 50 participants completing every trial without dropout or data loss.
The researchers are careful about the limits of their evidence. The simulator was fixed-base, without motion feedback or real risk perception, and the participants were mostly design and engineering professionals rather than ordinary tourist drivers, so physiological response intensities and population generalizability remain open questions. The analysis captured group-level trends without isolating the independent effects of individual design variables, no subjective workload scales such as NASA-TLX were administered to link physiology with felt experience, and the framework was validated on a single highway. The IoT sensing layer exists only as a reserved interface, not a deployed system. The authors also caution that the heart rate variability, skin conductance, and stress thresholds derived here cannot serve as absolute safety criteria without on-road validation. Future work aims to add machine learning prediction of physiological load, eye-tracking, multi-objective optimization of landscape layouts, and cross-regional trials on mountain, coastal, and suburban tourism highways to calibrate the method for broader engineering use.
Subject of Research: A human-factor evaluation framework combining BIM digital twins, immersive virtual driving, and physiological monitoring to assess tourism highway design
Article Title: A human-factor-driven evaluation framework of bim digital twins and immersive virtual driving for tourism highways
Article References: Cui, Y., Zhang, T., Li, X., Fu, Z., & Wu, Z. (2026). A human-factor-driven evaluation framework of bim digital twins and immersive virtual driving for tourism highways. Discover Artificial Intelligence, 6(1), Article 989. https://doi.org/10.1007/s44163-026-02110-5
Image Credits: AI Generated
DOI: 10.1007/s44163-026-02110-5
Keywords: digital twin, BIM, virtual driving, tourism highway, heart rate variability, skin conductance, driver stress, Unreal Engine 5, oblique photogrammetry, human factors, road design evaluation, driving simulator
Cite Scienmag News
Denise Maddox. (October 28, 2026). Virtual Driving Through a Digital Twin Reveals Which Highway Segments Stress Drivers Most. Scienmag. https://scienmag.com/virtual-driving-through-a-digital-twin-reveals-which-highway-segments-stress-drivers-most/
Denise Maddox. "Virtual Driving Through a Digital Twin Reveals Which Highway Segments Stress Drivers Most." Scienmag, 28 October 2026, https://scienmag.com/virtual-driving-through-a-digital-twin-reveals-which-highway-segments-stress-drivers-most/. Accessed 28 October 2026.
Denise Maddox. "Virtual Driving Through a Digital Twin Reveals Which Highway Segments Stress Drivers Most." Scienmag. October 28, 2026. https://scienmag.com/virtual-driving-through-a-digital-twin-reveals-which-highway-segments-stress-drivers-most/