


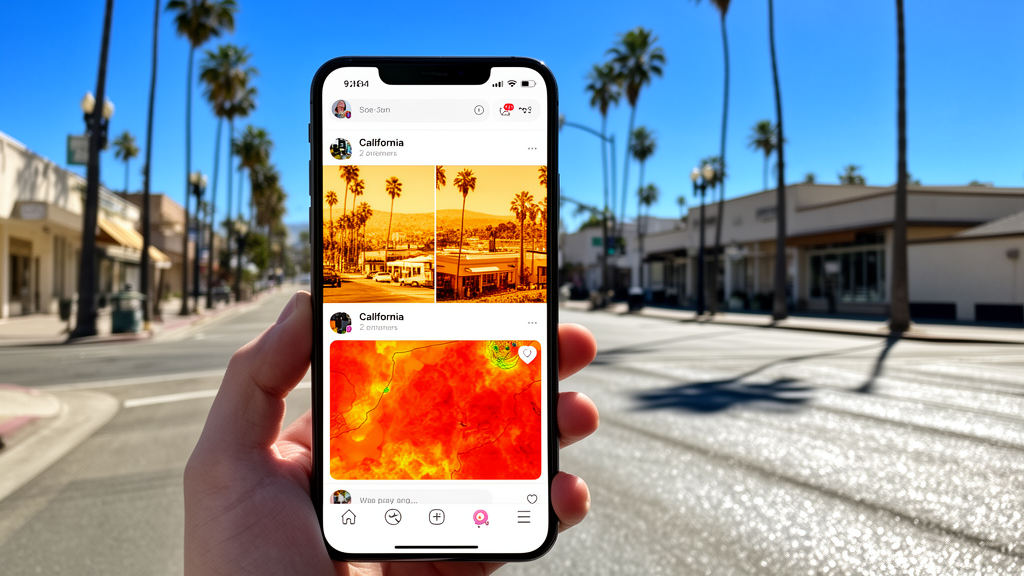
A peer-reviewed UC Irvine study of 24,598 heat-related posts on Twitter, now X, found that patterns in how people discussed extreme heat were associated with county-level characteristics including housing, transportation, income and tree canopy between 2016 and 2022. Posts were grouped by whether they described coping strategies, such as staying hydrated or changing when they exercised, or effects on daily life, such as disrupted work, canceled activities and changes in household expenses. The analysis suggests that social media can provide a complementary view of community-level heat experiences, but the researchers cautioned that these patterns are not direct measures of population vulnerability.
Published in Environmental Research Communications, the study examined public posts made from across California and compared their themes with county indicators associated with socioeconomic and physical conditions. The researchers focused on the language people used rather than relying only on temperatures, reported illnesses or conventional demographic measures. This approach allowed them to distinguish descriptions of coping behavior from accounts of heat’s consequences, including health effects, concerns about pets and plants, interrupted work and increased costs.
The resulting picture was not a single statewide ranking of risk, but a set of county-level associations between local conditions and the way heat appeared in online conversations. Housing produced one of the clearest relationships. Compared with counties where they were less common, counties with high levels of households living in recreational vehicles, vans or boats were 15 percent less likely to have positive heat-related posts and had 22 percent lower odds of posts discussing coping strategies.
The researchers described these housing types as “sensitive housing” and noted that such homes can have poor insulation and become dangerously hot during extreme temperatures. The analysis does not show that every person living in these settings experienced greater heat exposure, nor does it establish why fewer coping posts appeared. It identifies an association between housing composition and the prevalence of certain types of social media expression.
Transportation showed a different pattern. Counties with greater percentages of people who walked, bicycled or used public transportation to commute had substantially greater odds of negative heat-related posts and of posts describing effects on daily life. Active commuters can encounter direct heat exposure while traveling, and people using public transit may also spend time waiting, although the study did not measure the temperature or conditions experienced by individual posters.
The authors interpret the county-level findings as a reason for transportation infrastructure to be considered alongside housing when examining heat vulnerability. The results do not prove that commuting caused the greater frequency of negative or impact-related posts. Counties with larger Hispanic populations showed a slightly greater likelihood of posts describing heat’s impacts on daily life and a lower likelihood of posts about coping strategies.
The researchers cautioned that these social media patterns should not be treated as direct measures of population-level vulnerability. Their analysis does not establish the reasons for the observed differences or show that Hispanic residents as a group were more affected by heat. It also cannot account for people who did not post, including those who remained silent on the platform.
The finding instead points to geographic differences that may warrant further investigation when public-health agencies consider where heat communication is needed. To classify thousands of messages, the team used a large language model to group posts by how they discussed heat. It also demonstrated a technical route for analyzing a large collection of unstructured online conversations, although performance varied by category.
The model’s role was limited to organizing language for comparison with county-level indicators rather than directly determining whether a person was heat-exposed or medically vulnerable. The analysis also found that heat-related posting increased as average monthly temperatures rose. This relationship supports the idea that social media can act as an additional indicator of changing heat conditions, capturing conversations about overheated homes, altered commutes and canceled activities as events occur.
Such posts may reveal experiences that are not directly represented in temperature records, heat-related illness data or other established surveillance systems. The researchers explicitly presented social media monitoring as a complementary source of information, not a replacement for conventional public-health surveillance, direct community assessment or established measures of exposure. The authors envision combining these online signals with information about housing, transportation and socioeconomic conditions.
For example, the results suggest potential value in communication focused on indoor heat for communities with substantial numbers of RV, van or boat households, while transportation patterns may help identify places where heat exposure during travel deserves attention. More broadly, the authors said blending social media monitoring with automated language analysis could help guide targeted heat warnings, practical guidance and longer-term mitigation strategies. Several limitations define what can be concluded from the analysis.
It covers posts published from 2016 through 2022 and is geographically limited to California, so its results may not represent later platform behavior, other states or people who did not use the service. Its comparisons are at the county level and cannot establish that housing type, commuting patterns or Hispanic population share directly caused changes in individual posts or experiences. Even with those constraints, the study offers a detailed view of extreme heat as reflected in everyday online communication.
Across 24,598 posts, people described practical responses such as using air conditioning, staying hydrated, visiting a pool and changing exercise schedules, alongside effects including disrupted work, canceled plans and increased household costs. By comparing these themes with county indicators, the researchers demonstrated that social media can help identify where and how heat was being discussed in ways that conventional indicators alone may not capture. The central conclusion is therefore methodological as well as descriptive: automated language analysis, paired with local data and manual validation, can expose patterns in public conversation that may help researchers ask more specific questions about heat vulnerability without mistaking an online signal for a direct census of community risk.
Subject of Research: Social-media indicators of community heat vulnerability and coping in California
Article Title: Social media: Reading between the lines
Article References: Social media: Reading between the lines. Original publication (Bibliographic details unavailable.)
Image Credits: AI Generated
DOI: Not provided
Keywords: extreme heat, social media, California, heat vulnerability, housing, public transportation, large language models, public health, online communication, Social, media, Reading
Cite Scienmag News
Courtney Benton. (October 25, 2026). California study links social heat posts to local conditions. Scienmag. https://scienmag.com/california-study-links-social-heat-posts-to-local-conditions/
Courtney Benton. "California study links social heat posts to local conditions." Scienmag, 25 October 2026, https://scienmag.com/california-study-links-social-heat-posts-to-local-conditions/. Accessed 25 October 2026.
Courtney Benton. "California study links social heat posts to local conditions." Scienmag. October 25, 2026. https://scienmag.com/california-study-links-social-heat-posts-to-local-conditions/


