


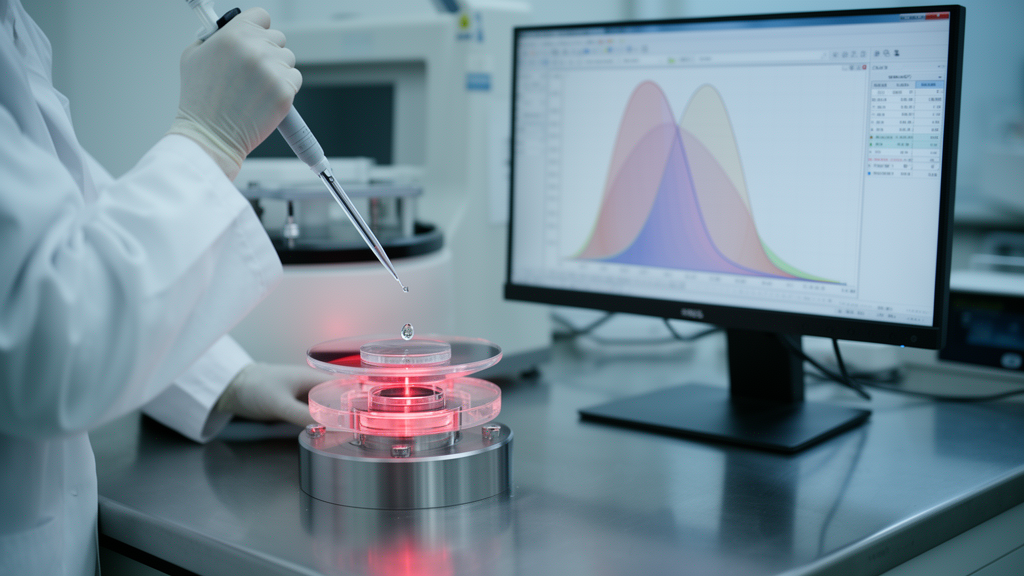
Oral submucous fibrosis, a chronic and potentially malignant disorder of the mouth strongly tied to chewing areca nut, may soon be detectable with nothing more than a drop of saliva, an infrared spectrometer, and a machine learning algorithm. In a study published in Frontiers in Oncology, researchers in India combined attenuated total reflection Fourier transform infrared (ATR-FTIR) spectroscopy of saliva with chemometric analysis and artificial intelligence to classify patients with oral submucous fibrosis (OSMF), individuals with adverse oral habits, and healthy controls. The results offer a striking glimpse of how non-invasive biochemical fingerprinting could reshape screening for one of the most challenging precancerous conditions of the oral cavity.
OSMF is a disorder of the Indian subcontinent first described by Schwartz in 1952, in which progressive fibrosis of the oral mucosa restricts mouth opening, causes burning sensations, and can eventually transform into oral squamous cell carcinoma. Millions of people worldwide consume areca nut, and reported prevalence of OSMF ranges from 0.03 percent to 30 percent. Diagnosis is notoriously difficult: the condition resembles other mucocutaneous disorders, histopathology remains the gold standard but is invasive and prone to inter-observer variability, and the very limited mouth opening characteristic of OSMF often hinders proper biopsy. These constraints have long fueled the search for objective, non-invasive diagnostic tools.
Saliva is an attractive medium for such tools. Roughly 98 percent water, it also carries enzymes, electrolytes, proteins, nucleic acids, antibodies, microorganisms, and cellular components that reflect both local and systemic health. It can be collected easily, repeatedly, and without expensive equipment. FTIR spectroscopy, which measures how molecules absorb infrared light at characteristic wavenumbers, can detect subtle biochemical shifts in this fluid. In ATR mode, a single drop of saliva supernatant placed on a zinc selenide crystal yields an absorbance spectrum spanning 400 to 4000 cm⁻¹, capturing vibrational features from proteins, lipids, and carbohydrates in minutes.
The research team, a collaboration between the Dental Institute at Rajendra Institute of Medical Sciences in Ranchi and the Birla Institute of Technology, enrolled 450 participants in three equal groups: 150 patients with clinically diagnosed OSMF, 150 individuals with areca nut or tobacco habits but no clinical evidence of OSMF, and 150 healthy controls. Groups were age matched within two years, and the OSMF and habit groups were also matched for duration of tobacco use. Unstimulated whole saliva was collected in the morning, centrifuged at 2500 × g for 15 minutes at 4 °C, and the supernatant was stored at −80 °C. Spectra were recorded on a Shimadzu IR Prestige-21 spectrometer at 4 cm⁻¹ resolution with 32 scans per measurement.
Rigorous spectral preprocessing underpinned the analysis. Raw spectra underwent baseline correction and normalization, followed by Savitzky–Golay smoothing with a window length of 11 and polynomial order 3 to suppress instrumental noise while preserving peak morphology. Mean noise removal was 0.05 percent with a maximum peak correction of 0.33 percent. Each sample was represented by 1001 absorbance readings. The machine learning pipeline embedded Standard Scaler and principal component analysis (PCA) within the classification framework, so that scaling and dimensionality reduction were fitted independently on the training portion of each cross-validation fold, preventing validation-fold leakage. Four classifiers were compared: Decision Tree, Random Forest with 500 trees, support vector machine with an RBF kernel, and XGBoost, a gradient-boosting method whose hyperparameters were tuned via grid search over n_estimators, max_depth, and learning rate.
PCA revealed that the first two principal components explained 89.26 percent and 6.95 percent of total spectral variance respectively, cumulatively 96.21 percent, indicating that the dominant separation among Normal, Habit, and OSMF samples is captured within the first two components, largely reflecting broad differences in overall absorbance intensity and the amide- and lipid-associated spectral region. One-way ANOVA performed independently at each of the 1001 wavenumber positions identified 157 nominally significant wavenumbers (p < 0.05) forming one continuous region from 1581 to 2142 cm⁻¹. The 1581–1700 cm⁻¹ portion encompasses protein-associated Amide I and Amide II vibrations, while the 1700–2000 cm⁻¹ region includes carbonyl-related C=O stretching vibrations from lipids. The ten most significant wavenumbers clustered at 1998–2045 cm⁻¹ with F ≈ 9.0 and p ≈ 0.003. None remained significant after Bonferroni correction, however, suggesting subtle biochemical differences that warrant further investigation rather than a validated disease-specific biomarker.
XGBoost emerged as the clear winner. In stratified 10-fold cross-validation it achieved accuracies of 90.62 percent for Normal versus Habit, 97.67 percent for Normal versus OSMF, and 91.30 percent for three-class classification, with a mean F1-score of 0.9131 and specificity of 0.9565. Random Forest followed closely with 79.49 percent cross-validation accuracy in the three-class task, while Decision Tree reached 75.93 percent and SVM lagged substantially at 57.46 percent, suggesting that the spectral differences among groups are not adequately represented by a simpler decision boundary after PCA reduction. Bootstrap resampling with 1000 iterations confirmed the robustness of XGBoost, whose estimated accuracy ranged from 91.5 to 95.8 percent. On an internal test dataset of 90 samples, the optimized XGBoost model achieved a weighted average precision, recall, and F1-score of 0.88, with OSMF showing the highest precision at 0.93 and Normal the highest recall at 0.93. One-vs-rest ROC analysis demonstrated excellent discriminatory performance, with XGBoost achieving the highest AUC values across all three classes.
The critical test came with an independent external validation cohort of 90 new participants, 30 in each group, whose saliva was analyzed with the identical protocol. For OSMF versus normal classification, the model achieved 80.0 percent accuracy, 83.9 percent sensitivity, 75.9 percent specificity, and an F1-score of 81.3 percent. For Habit versus Normal, performance dropped to 71.7 percent accuracy with 68.6 percent sensitivity and 76.0 percent specificity. This decline is common in translational machine learning studies and likely reflects real-world variability in saliva composition, participant characteristics, sample handling, and spectral acquisition. Importantly, the external results indicate the model is not simply overfitting the training data, and the stronger performance for OSMF detection than for habit status suggests that established disease produces a more distinct biochemical fingerprint than exposure alone.
The biological plausibility of the findings rests on the pathology of OSMF itself. The disorder is characterized by chronic inflammation, altered extracellular-matrix turnover, and progressive fibrosis, processes that may alter the abundance or composition of salivary proteins, lipids, and other soluble constituents. The overlap of the nominally significant region with amide-associated vibrations is consistent with the fibrotic nature of OSMF and supports the concept that FTIR can capture disease-related biochemical signatures in saliva. The 2000–2142 cm⁻¹ sub-region, however, does not correspond to a classical amide band and is more consistent with combination and overtone vibrations from protein, lipid, and carbohydrate constituents; the authors caution that its biological interpretation should be considered tentative pending further spectral assignment work. PCA components, being mathematical combinations of multiple correlated wavelengths, should likewise not be interpreted as individual biochemical biomarkers.
The authors position salivary ATR-FTIR as a complementary, non-invasive screening and risk-stratification approach rather than a replacement for clinical examination or histopathology when biopsy is indicated. The ability to distinguish habit users from healthy controls hints at utility in identifying individuals who warrant closer surveillance, particularly where access to biopsy or repeated specialist follow-up is limited. Several limitations temper enthusiasm: the study was conducted at a single center, the cohort was predominantly male (98 percent of OSMF patients), OSMF diagnosis was primarily clinical, and hyperparameter optimization and performance estimation used the same cross-validation framework rather than a fully nested design, meaning the reported internal accuracies should be interpreted as potentially optimistic upper-bound estimates. Larger, demographically diverse, multicenter studies with balanced sex representation, strictly nested cross-validation, and prospective clinical evaluation are needed before this approach can be considered for routine clinical implementation. Still, the prospect of a saliva-based infrared test that flags a precancerous oral condition in minutes is a compelling step toward non-invasive cancer risk screening.
Subject of Research: Machine learning analysis of salivary ATR-FTIR spectra for non-invasive diagnosis of oral submucous fibrosis
Article Title: Machine learning-assisted chemometric analysis of salivary ATR-FTIR spectra for the diagnosis of oral submucous fibrosis
Article References: Shree, P., Aggarwal, Y., Kumar, M., Saxena, P., Singh, N. N., Chandra, A., Srivastava, P., Nag, S., & Rai, A. (2026). Machine learning-assisted chemometric analysis of salivary ATR-FTIR spectra for the diagnosis of oral submucous fibrosis. Frontiers in Oncology, 16, Article 1927981. https://doi.org/10.3389/fonc.2026.1927981
Image Credits: AI Generated
DOI: 10.3389/fonc.2026.1927981
Keywords: Machine, learning-assisted, chemometric, analysis, salivary, ATR-FTIR, spectra, diagnosis, oral, submucous, fibrosis, scientific research
Cite Scienmag News
Ophelia Keating. (October 19, 2026). AI Reads Saliva Infrared Spectra to Detect Oral Fibrosis. Scienmag. https://scienmag.com/ai-reads-saliva-infrared-spectra-to-detect-oral-fibrosis/
Ophelia Keating. "AI Reads Saliva Infrared Spectra to Detect Oral Fibrosis." Scienmag, 19 October 2026, https://scienmag.com/ai-reads-saliva-infrared-spectra-to-detect-oral-fibrosis/. Accessed 19 October 2026.
Ophelia Keating. "AI Reads Saliva Infrared Spectra to Detect Oral Fibrosis." Scienmag. October 19, 2026. https://scienmag.com/ai-reads-saliva-infrared-spectra-to-detect-oral-fibrosis/


