


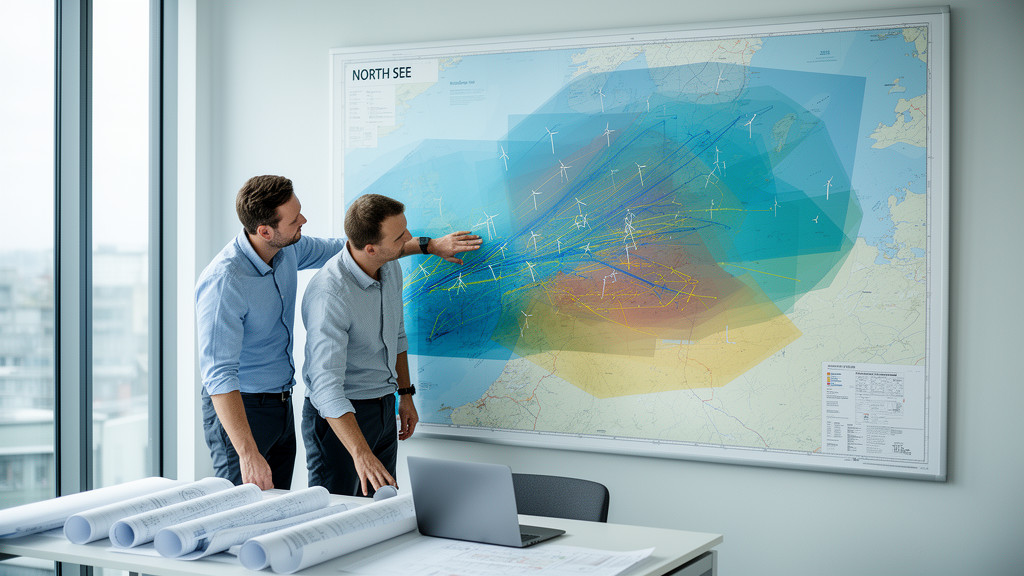
The North Sea is one of the busiest corners of the world ocean, and it is about to get busier. Bottom trawlers drag nets across its shallow seabed, cargo ships funnel toward Rotterdam, Antwerp, Le Havre and Hamburg, underwater cables crisscross the floor, and fixed-base offshore wind farms are expanding at a pace few predicted a decade ago. All of these activities press on the same ecosystems at the same time, and the combined weight of those pressures is what marine scientists call cumulative effects. A team of French and Belgian researchers has now upgraded one of the tools used to map that combined risk, and tested it across two very different North Sea case studies, from the crowded Bay of Seine to the entire sea basin. Their findings, published in Frontiers in Ocean Sustainability, offer maritime spatial planners something they have long lacked: a clearer, more honest picture of which activities are truly unsuitable where.
The work matters because maritime spatial planning, or MSP, is the European Union’s flagship instrument for organizing human uses of the sea. The EU’s Blue Economy directly employed nearly 3.59 million people in 2021 and generated a turnover of around 623.6 billion euros, and marine renewable energy, mainly offshore wind, saw gross profits jump 45 percent compared with 2020. But the same directive that requires Member States to establish national MSPs also demands an ecosystem-based approach, consistent with environmental legislation such as the Marine Strategy Framework Directive. To plan sustainably, planners need to understand the combined effects of existing and future activities on the environment, and that is precisely what Cumulative Effects Assessments, or CEAs, are meant to deliver. Despite numerous national and international initiatives, their application in MSP still needs further development.
The core problem is deceptively simple. Most existing CEA tools describe the relationship between an activity and a pressure in binary terms: an activity either causes a pressure or it does not. A scuba diver and a bottom trawler both cause abrasion, so in a normalized calculation their maximum contributions count equally, even though the trawler abrades square kilometers of seabed for every hour of fishing while the diver disturbs a few square meters. The researchers, led by Alexis Esquerré of Cerema with colleagues from the French Biodiversity Office and ILVO in Belgium, addressed this by attributing a magnitude value to each activity-pressure relationship, approximating the proportion of the environment affected by the activity. Sea bottom physical pressures were assigned magnitudes based on the area potentially affected by one unit of activity intensity, while modifications of seawater properties were based on the volume affected.
The tool they upgraded, the RCE Carpediem tool, is an open-source program written in the R language, first published in 2020 by the French Biodiversity Office. It uses relative intensities of human activities to estimate the intensity of the pressures they generate, then calculates a Risk of Cumulative Effect based on the surface area and sensitivities of benthic habitats to various pressures, delivering results on a grid covering the study area. The new version adds a third matrix listing the magnitude of each activity for each pressure, alongside the existing activity-pressure matrix and the sensitivity matrix of ecological components. The final weighted relationship between an activity and a pressure is defined as the product of a binary variable indicating whether the activity causes the pressure, and ten raised to the power of the corresponding magnitude, so a relationship with a magnitude of three carries a weight of one thousand.
One subtlety required careful handling. After summing the weighted contributions of activities, the tool applies a log-normalization that rescales each pressure between zero and one across the study area. That step is essential for comparing pressures described in different units, but it would also erase the magnitude correction: a pressure caused by a single activity of high magnitude and a pressure caused by a single activity of low magnitude would end up with the same range. To solve this distortion, the researchers readjusted each normalized pressure using the highest weighted relationship among all activities that can generate it, a precautionary choice consistent with the risk-assessment framework. The result is a calculation that preserves the relative scales at which different pressures are capable of affecting the environment.
The team also added something genuinely new: a module of activity unsuitability. For each grid cell, the module compares all the pressures generated by each activity, weighted by their magnitudes, against the total sensitivities of the habitats in that cell. An activity is more unsuitable wherever ecosystem components are highly sensitive to whichever pressures the activity emits at high magnitude. Crucially, unsuitability does not depend on how intensely the activity is currently carried out, which makes it a planning reference rather than a snapshot of present conditions. A companion activity risk indicator then multiplies unsuitability by actual activity intensity, flagging cells where an unsuitable activity is nonetheless being carried out intensely.
Two case studies tested the approach at contrasting scales. The first, at local scale, covered the Bay of Seine off the Seine river estuary on the French side of the English Channel, an area packed with harbor traffic from Le Havre, fishing, one operational offshore wind farm, one under construction, and one designated exploration zone. The second covered the Greater North Sea restricted to the maritime spaces of EU Member States, from France, Belgium and the Netherlands to Germany, Denmark and Sweden, including the Danish Straits, Kattegat and Skagerrak. The local study used a grid of one minute of degree per cell with national French datasets; the sea-basin study used larger three-minute cells with harmonized data from the European Marine Observation and Data Network, EMODnet. The grids align perfectly: each sea-basin cell contains exactly nine local cells.
The comparison of methods in the Bay of Seine produced a result that should reassure skeptical planners. Weighting pressures by their magnitude refined the calculation without altering the overall distribution of results: the decile boundaries of the risk series differed on average by only about 0.03 between the two methods, and the same broad areas of high and low risk emerged. The southern part of the bay, closest to the estuary where bottom trawling and traffic from Le Havre concentrate, remained a consistent hotspot. But the differences were telling. The binary method flagged two permanently present underwater cables in the north of the study area as a major source of risk, which the weighted method did not, since cables affect only a few square meters around them. Conversely, the weighted method revealed higher risk around the operational offshore wind farm in the east, an area the binary method underestimated because other activities are restricted inside wind farm boundaries, leaving the farm as the sole generator of certain pressures there.
At sea-basin scale, the assessment identified large areas of high risk off the northern coasts of Normandy and the Bay of Somme, in patches of the Danish Straits, east of the Doggerbank sand bank, and in the Skagerrak, while offshore areas near Denmark and off the western Netherlands showed lower risk. Importantly, the spatial distribution of risk differed from the distribution of total activity intensity, confirming that higher concentrations of activities do not necessarily produce higher calculated risk, and that the tool maps risk rather than merely activity. The Bay of Seine extract from the sea-basin results was broadly similar to the local results but less precise, with noise and artifacts attributed to the coarser habitat map. The researchers conclude that the question an assessment is meant to answer should drive the choice of scale: national planning benefits from local-scale detail, while international coordination needs a basin-wide reference.
The unsuitability results may prove the most immediately useful for planners. In the Bay of Seine, pelagic trawling was generally far more unsuitable for benthic habitats than maritime traffic, yet both activities showed comparable unsuitability values above one thousand near the Seine estuary, and traffic was considerably more unsuitable there than across most of the bay. In the Greater North Sea, pelagic trawling unsuitability was higher in offshore areas and the Danish Straits than in the Channel. The authors caution that data accuracy, especially habitat sensitivities, is crucial: habitats with few known sensitivities, such as patches classified at low EUNIS detail in the Skagerrak, can depress calculated unsuitability and mask real conflicts. Remaining challenges include expert-judgment sensitivity values, the poor integration of food-web pressures and temporal dynamics, and the fact that the tool cannot yet credit activities with positive effects, such as wind farms acting as artificial reefs. Still, by weighting pressures by their real spatial reach and revealing where sensitive habitats collide with high-magnitude activities, the upgraded framework gives ecosystem-based maritime spatial planning a sharper instrument than it has ever had.
Subject of Research: Implementation of cumulative effect assessments in maritime spatial planning: insights from two North Sea case studies
Article Title: Implementation of cumulative effect assessments in maritime spatial planning: insights from two North Sea case studies
Article References: Esquerré, A., Quemmerais-Amice, F., Gimard, A., Van Hoey, G., Quentric, A., & Laroussinie, O. (2026). Implementation of cumulative effect assessments in maritime spatial planning: insights from two North Sea case studies. Frontiers in Ocean Sustainability, 4, Article 1800336. https://doi.org/10.3389/focsu.2026.1800336
Image Credits: AI Generated
DOI: 10.3389/focsu.2026.1800336
Keywords: Implementation, cumulative, effect, assessments, maritime, spatial, planning, insights, North, case, studies, scientific research
Cite Scienmag News
Violet Maxwell. (October 17, 2026). North Sea planners get sharper maps of how human activities stack up. Scienmag. https://scienmag.com/north-sea-planners-get-sharper-maps-of-how-human-activities-stack-up/
Violet Maxwell. "North Sea planners get sharper maps of how human activities stack up." Scienmag, 17 October 2026, https://scienmag.com/north-sea-planners-get-sharper-maps-of-how-human-activities-stack-up/. Accessed 17 October 2026.
Violet Maxwell. "North Sea planners get sharper maps of how human activities stack up." Scienmag. October 17, 2026. https://scienmag.com/north-sea-planners-get-sharper-maps-of-how-human-activities-stack-up/


