


…
The distinction between deep water and shallow water classes in the Bahr Al-Najaf classification scheme reflects a challenge familiar to anyone mapping wetlands from orbit: water is not a single spectral target but a continuum whose signature shifts with depth, turbidity, suspended sediment, and sun glint. By separating these two states, the study captures something a binary water mask would miss — the gradual drying or flooding of the depression’s margins, which is precisely where ecological transitions happen first. Shallow zones are the nursery habitats for aquatic invertebrates, the foraging grounds for wading birds, and the first areas to expose bare sediment during drought. Tracking their expansion and contraction independently of deep water therefore provides a more ecologically meaningful record than total water area alone, and the same logic applies directly to estuaries, where intertidal flats and shallow subtidal zones support different communities and respond differently to tidal and riverine forcing.
The choice of a spring and early summer acquisition window deserves attention because it controls for one of the most persistent confounds in multi-decadal change detection: phenology. Vegetation in semi-arid regions greens up briefly after winter rains and then browns rapidly, so comparing a March image from one year with a July image from another could manufacture apparent change where none exists. By holding the seasonal window constant and requiring cloud cover below five percent, the authors reduce the risk that observed transitions between wet soil, dry soil, and vegetation-mixed classes are artifacts of timing rather than genuine landscape dynamics. This discipline matters enormously in arid environments, where a single storm event can transform spectral signatures across hundreds of square kilometers within days.
The atmospheric correction step, converting raw digital numbers first to top-of-atmosphere reflectance and then to surface reflectance using the FLAASH model, addresses a subtler but equally important problem. Satellites measure radiance at the sensor, which includes light scattered by the atmosphere itself — aerosols, water vapor, and haze that vary from date to date and between sensors. Landsat 7’s Enhanced Thematic Mapper Plus and the Operational Land Imagers aboard Landsat 8 and 9 differ in their spectral band positions and radiometric characteristics, so without harmonization, some fraction of any detected change could reflect instrument differences rather than land surface change. Surface reflectance products place all scenes on a common physical footing, which is what allows a 23-year comparison to be interpreted with confidence. The additional step of clipping every dataset to an identical 435.8 square kilometer boundary ensures that area statistics are computed over exactly the same footprint in every epoch, eliminating edge effects that could otherwise distort percentage calculations.
Random Forest’s suitability for this kind of mapping stems from its architecture as an ensemble of decision trees, each trained on a random subset of the training data and a random subset of the spectral bands. This built-in randomness makes the classifier resistant to overfitting and to the noise that inevitably accompanies satellite imagery of heterogeneous terrain. The configuration used here — five hundred trees, with the number of candidate features at each split set to the square root of the total input bands — follows Breiman’s original recommendations and represents a standard that has proven robust across many land cover applications. The out-of-bag error estimate, derived from the roughly one-third of training samples excluded from each tree’s bootstrap sample, provides an internal check on model stability without consuming any of the independent validation data. The reported overall accuracy of 92.1 percent, validated against 250 stratified random points, sits comfortably within the range generally considered reliable for thematic mapping, and the stratification of the validation sample ensures that rare classes are not evaluated on the basis of a handful of points.
The post-classification comparison technique used for change detection carries its own methodological logic. Rather than differencing raw spectral values between dates — an approach vulnerable to atmospheric and sensor inconsistencies — it compares independently produced classification maps, pixel by pixel, to build a matrix of from-to transitions. The trade-off is that any classification error propagates into the change estimate, which is why the accuracy assessment matters so much: with overall accuracy above ninety percent, the dominant transitions reported, such as the conversion of dry soil and wet soil to built-up areas on the eastern plateau, are far larger than the plausible error envelope. The technique also yields information that continuous index-based methods cannot easily provide, namely the direction of change — which class lost area to which other class — rather than just a net difference.
The hydrological trajectory documented in the depression mirrors patterns observed across the Middle East and beyond. The plunge in water extent to 47.4 square kilometers at the 2015 drought peak coincides with one of the most severe multi-year droughts recorded in the Fertile Crescent, a period during which declining precipitation, shrinking upstream flows, and groundwater over-extraction combined to stress surface water systems across Iraq, Syria, and Iran. The partial recovery observed afterward, which the study notes aligns with NASA’s regional observations, likely reflects both climatic relief and water management decisions upstream. Yet the failure of water extent to return to its 2002 baseline by 2025 — remaining at 74.12 square kilometers, less than half the initial area — suggests that recovery in such systems is often incomplete, with each drought potentially resetting the system to a lower regime. This ratchet-like behavior, where wet periods fail to fully restore prior conditions, is a hallmark of systems approaching hydrological thresholds and has been documented in closed-basin lakes and wetlands from Central Asia to the American Southwest.
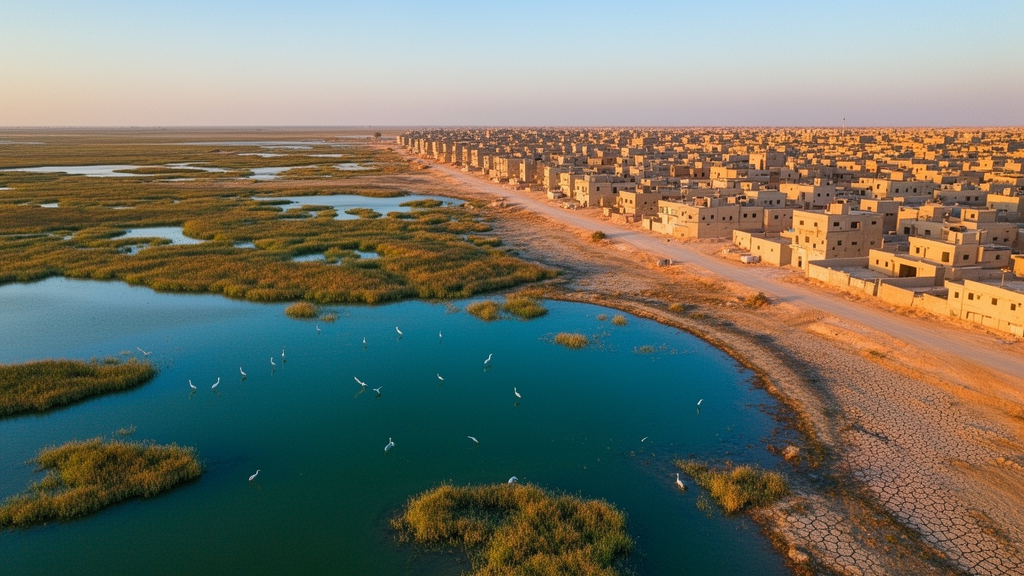
The 192 percent expansion of built-up area, concentrated on the stable eastern plateau, illustrates how topography channels development. The digital terrain map analysis showing that slope and elevation constraints deterministically direct urban growth is consistent with a well-established principle in land change science: flat, stable, well-drained terrain is developed first, while flood-prone lowlands are avoided until land pressure forces expansion into marginal areas. The irony in the Bahr Al-Najaf case is that the low-lying center of the depression, avoided by developers, is precisely the zone most exposed to hydrological shocks — it floods when water returns and desiccates when water departs. This spatial mismatch between where people build and where water goes is a recurring feature of wetland-adjacent urbanization worldwide, from the margins of Lake Chad to the fringes of coastal lagoons, and it complicates conservation planning because infrastructure, once established, creates political and economic inertia against future hydrological restoration.
The groundwater findings cited in the surrounding literature add an important dimension to the water story. Salinity levels that render groundwater unsuitable for drinking or industrial use mean that the depression’s surface water cannot be casually replenished from local aquifers, and that any agricultural or urban expansion around the depression places additional demands on surface allocations that are themselves under strain. In endorheic or poorly flushed basins, evaporation concentrates salts over time, so declining water levels tend to increase salinity further, creating a feedback that degrades remaining habitat quality even as habitat quantity shrinks. Similar salinity dynamics plague coastal lagoons subjected to reduced freshwater inflow, where seawater intrusion replaces river water and fundamentally restructures the ecosystem.
The interest of UNESCO’s Man and the Biosphere program, alongside the IUCN, UNEP, and WWF, in the Bahr Al-Najaf region signals that its ecological value extends beyond national boundaries. Wetlands in arid zones function as critical stopover and breeding habitat for migratory birds traversing the African-Eurasian flyways, and their loss reverberates across continents. The documented interplay between fluctuating water levels and the surrounding land cover — with wet soil zones expanding and contracting as the water margin moves — defines the dynamic habitat mosaic on which such species depend. A wetland that is permanently full and one that is permanently dry both support less biodiversity than one that pulses, but only within limits; the collapse to a tenth of the study area in water extent during 2015 falls well outside the historical range of natural variability that migratory species would have evolved to accommodate.
For practitioners seeking to apply this framework elsewhere, several elements of the workflow are worth emphasizing. The reliance on freely available Landsat data means the approach costs nothing in imagery, an essential consideration for monitoring programs in developing regions where commercial satellite tasking is unaffordable. The use of high-resolution Google Earth archival imagery as a substitute for field-based training data in historical periods is a pragmatic and increasingly common solution to the impossibility of ground-truthing the past, though it introduces the limitation that very small or spectrally ambiguous features may be mislabeled. The five-class scheme itself — deep water, shallow water, dry soil, wet soil, and built-up — is deliberately parsimonious, avoiding the accuracy penalties that accompany overly detailed legends in spectrally difficult environments. For estuarine applications, the same structure could be adapted with classes such as tidal flats, submerged aquatic vegetation, and salt marsh, and the wet soil category would map naturally onto the saturated intertidal zone where spectral mixing between water and land is most severe.
The 30-meter spatial resolution of the Landsat sensors sets the practical floor for what can be resolved. Patches of habitat smaller than roughly one pixel, narrow channels, and linear features such as roads or levees will be subsumed into surrounding classes, which means the built-up totals reported here likely undercount linear infrastructure while the water totals may miss narrow inlets. For estuaries, where channel networks and tidal creeks are often narrower than 30 meters, combining Landsat-based classification with higher-resolution imagery or radar data would be a natural extension. Synthetic Aperture Radar in particular offers cloud-penetrating observation of water surfaces, complementing optical data in perpetually cloudy coastal climates where the five percent cloud cover threshold used here would be difficult to meet.
Finally, the 23-year span of this analysis demonstrates the value of patience in environmental monitoring. Short-term studies capture snapshots that may reflect a wet year or a dry year rather than a trend; the trajectory documented here — expansion, collapse, partial recovery, and continued urban growth — only becomes legible across decades. As climate change intensifies hydrological variability in the arid belt stretching from North Africa through the Middle East and Central Asia, the wetlands of this region will face increasingly frequent excursions beyond their historical ranges. Frameworks like the one applied to Bahr Al-Najaf, being reproducible, low-cost, and transferable across inland, estuarine, and coastal settings, offer resource managers a practical means of building the long observational records needed to distinguish natural fluctuation from directional degradation, and to intervene while intervention remains possible.
Subject of Research: …
Article Title: Monitoring land cover dynamics in the Bahr Al-Najaf wetland: A transferable remote sensing framework for inland and coastal wetland management (2002–2025)
Article References: Al Helaly, E. A., Al Rammahi, A. H., & Muhsin, I. J. (2026). Monitoring land cover dynamics in the Bahr Al-Najaf wetland: A transferable remote sensing framework for inland and coastal wetland management (2002–2025). Estuarine Management and Technologies, 3, 41-63. https://doi.org/10.3897/emt.3.182442
Image Credits: AI Generated
DOI: 10.3897/emt.3.182442
Keywords: remote sensing, wetlands, land cover change, Random Forest, Iraq, satellite monitoring, urban expansion, hydrology, Monitoring, land, cover, dynamics
Cite Scienmag News
Violet Maxwell. (October 16, 2026). Iraq’s Bahr Al-Najaf wetland loses nearly half its water as urban sprawl surges 192 percent. Scienmag. https://scienmag.com/iraqs-bahr-al-najaf-wetland-loses-nearly-half-its-water-as-urban-sprawl-surges-192-percent/
Violet Maxwell. "Iraq’s Bahr Al-Najaf wetland loses nearly half its water as urban sprawl surges 192 percent." Scienmag, 16 October 2026, https://scienmag.com/iraqs-bahr-al-najaf-wetland-loses-nearly-half-its-water-as-urban-sprawl-surges-192-percent/. Accessed 16 October 2026.
Violet Maxwell. "Iraq’s Bahr Al-Najaf wetland loses nearly half its water as urban sprawl surges 192 percent." Scienmag. October 16, 2026. https://scienmag.com/iraqs-bahr-al-najaf-wetland-loses-nearly-half-its-water-as-urban-sprawl-surges-192-percent/


