


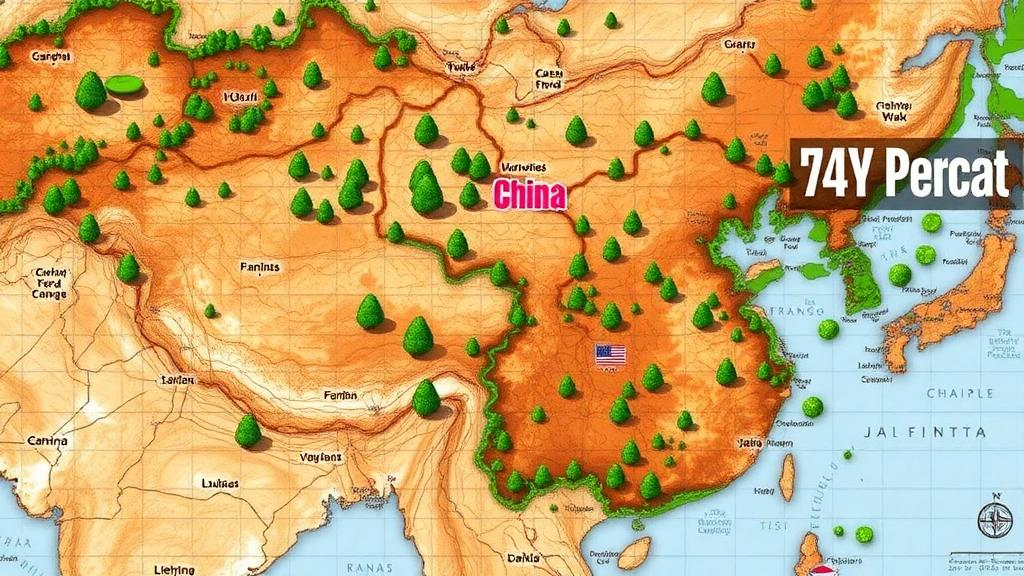
China has quietly added tens of billions of trees over the past four decades, and for the first time scientists can see exactly where they stand. A research team led by Ziyi Xian, Zhen Yu, Jinge Yu, and Shirong Liu has unveiled ChinaTD30, an annual tree-density dataset that maps the number of trees across the entire country at a resolution of 30 meters, year by year, from 1985 through 2022. The dataset, described in a preprint under review for the journal Earth System Science Data, reveals that forest trees in China increased from roughly 106 billion in 1985 to about 182 billion in 2022, a rise of approximately 72 percent. Trees growing outside formally designated forests, often overlooked in national statistics, more than doubled over the same period, climbing from about 2.3 billion to 5.1 billion individuals.
The scale of the reconstruction is unprecedented for a single country. To build it, the team assembled four complete cycles of China’s National Forest Inventory, each cycle containing 670,279 field plot observations in which trained surveyors counted and measured trees on the ground. These inventory plots provide the ground truth, but they are sparse samples scattered across a continent-sized landscape. The researchers therefore fused them with long-term satellite observations, forest attribute layers, land-cover classifications, and environmental variables such as climate and terrain, allowing machine-learning models to learn the relationship between what satellites see from orbit and what surveyors count on the ground. Once trained, the models could predict tree density for every 30-meter pixel in China for every year in the record.
Choosing the right modelling strategy was one of the central technical challenges. The team evaluated three distinct approaches designed to balance prediction accuracy against temporal consistency, a trade-off that plagues long-term remote-sensing products. Models tuned independently for each time period can achieve high accuracy but produce jarring artificial jumps between years, making trends impossible to interpret. A single model trained across all epochs sacrifices some accuracy but delivers a coherent time series in which real changes can be separated from statistical artifacts. For the released product, the authors adopted a temporally unified model, ensuring that the dramatic increase in tree numbers they report reflects genuine ecological change rather than shifting calibration.
The 30-meter resolution matters enormously. Earlier tree-density products for China were generally limited by coarse spatial resolution, restricted temporal coverage, or a narrow focus on forested areas alone. At coarse resolutions, a single pixel may average together intensively managed plantations, sparse woodlands, orchards, and scattered roadside trees, erasing the heterogeneity that governs how forests store carbon, shelter biodiversity, and regulate water. By resolving individual Landsat-scale pixels, ChinaTD30 captures fine-grained variation across both forest and non-forest ecosystems, from the dense subtropical forests of the southeast to the scattered trees of dry northern landscapes where restoration programs have transformed the terrain.
One of the study’s most striking findings concerns trees outside forests. These are the trees lining roads, shading farms in agroforestry systems, dotting village edges, and colonizing abandoned land, and they are systematically undercounted in conventional forest statistics that define forests by area and canopy threshold. The dataset shows that this non-forest tree population grew from roughly 2.3 billion to 5.1 billion individuals between 1985 and 2022. While small compared with the forest total, these trees contribute disproportionately to local livelihoods, soil protection, and carbon storage in densely populated agricultural regions, and their explicit inclusion marks an important step toward a complete national accounting of woody vegetation.
The spatial pattern of the increase is equally revealing. Tree number gains were evident not only across the northern restoration regions, where decades of ambitious afforestation and shelterbelt programs have planted billions of seedlings, but also in densely forested southeastern China. That latter result is significant because it suggests the trend is not merely a story of planting trees on barren land. In the humid south, existing forests appear to have thickened and expanded through natural regrowth, forest maturation, and management changes, indicating that China’s tree boom is a broad national phenomenon rather than a narrow plantation story confined to the north.
Beneath the headline numbers, the dataset exposes a subtle demographic signal: tree density follows distinct age-related patterns in natural versus planted forests. In both forest types, densities generally peak in young-to-middle-aged stands before declining in older stands, but the shapes and timing of these curves differ between natural and planted systems. This age-density relationship carries direct implications for carbon science, because stand age is a key driver of growth rates, mortality, and carbon accumulation. As large areas of China’s planted forests mature, density-dependent thinning and rising mortality could alter the trajectory of the national forest carbon sink, and a spatially explicit, annually resolved density record provides exactly the kind of evidence needed to anticipate that transition.
The comparison with existing tree-density products also delivers a cautionary message. When the authors benchmarked ChinaTD30 against other available datasets, they found large discrepancies, particularly in densely forested regions. The mismatches partly reflect differences in training data, spatial resolution, and model structure, a reminder that satellite-derived ecological products are model outputs shaped by methodological choices rather than direct measurements. By documenting where and why products disagree, the new dataset gives users a clearer sense of uncertainty, and the release includes uncertainty estimates alongside the density predictions themselves, allowing downstream studies to propagate error rather than treat maps as gospel.
The applications span an unusually wide range of Earth science. Forest demographers can use the annual density series to study recruitment, competition, and mortality at national scale. Carbon-cycle modelers can convert tree counts and density changes into more robust estimates of biomass and carbon stocks, sharpening assessments of how much atmospheric carbon dioxide China’s landscapes absorb. Land managers can evaluate whether restoration investments are actually producing the intended tree populations, and ecologists can examine how trees outside forests buffer agricultural landscapes against erosion and heat. Because the record extends back to 1985, it also captures the era of China’s most intensive ecological engineering, offering a natural experiment in large-scale restoration that few countries can match.
The dataset is openly available through Zenodo, with the release organized into nine associated part records, and the underlying preprint is under open review for Earth System Science Data, a journal specializing in the publication of citable, high-quality scientific data. As the record of China’s forests grows by another 72 percent in tree numbers, the deeper value of ChinaTD30 may lie in what it enables next: turning a national greening story into quantitative, testable science about how forests recover, how trees die, and how a changing landscape reshapes the planet’s carbon balance, one 30-meter pixel at a time.
Subject of Research: An annual 30 m tree-density dataset for China from 1985 to 2022 built from national forest inventory data and satellite observations
Article Title: ChinaTD30: An annual 30 m tree density dataset for China (1985–2022)
Article References: Xian, Z., Yu, Z., Yu, J., & Liu, S. (2026). ChinaTD30: An annual 30 m tree density dataset for China (1985–2022). https://doi.org/10.5194/essd-2026-813
Image Credits: AI Generated
Keywords: tree density, China, forest inventory, remote sensing, afforestation, carbon cycling, forest restoration, 30 m resolution, trees outside forests, forest demography, Earth System Science Data, long-term dataset
Cite Scienmag News
Violet Maxwell. (October 13, 2026). China’s Trees Surge by 72 Percent as New 30-Meter Map Tracks Four Decades of Forest Change. Scienmag. https://scienmag.com/chinas-trees-surge-by-72-percent-as-new-30-meter-map-tracks-four-decades-of-forest-change/
Violet Maxwell. "China’s Trees Surge by 72 Percent as New 30-Meter Map Tracks Four Decades of Forest Change." Scienmag, 13 October 2026, https://scienmag.com/chinas-trees-surge-by-72-percent-as-new-30-meter-map-tracks-four-decades-of-forest-change/. Accessed 13 October 2026.
Violet Maxwell. "China’s Trees Surge by 72 Percent as New 30-Meter Map Tracks Four Decades of Forest Change." Scienmag. October 13, 2026. https://scienmag.com/chinas-trees-surge-by-72-percent-as-new-30-meter-map-tracks-four-decades-of-forest-change/


