


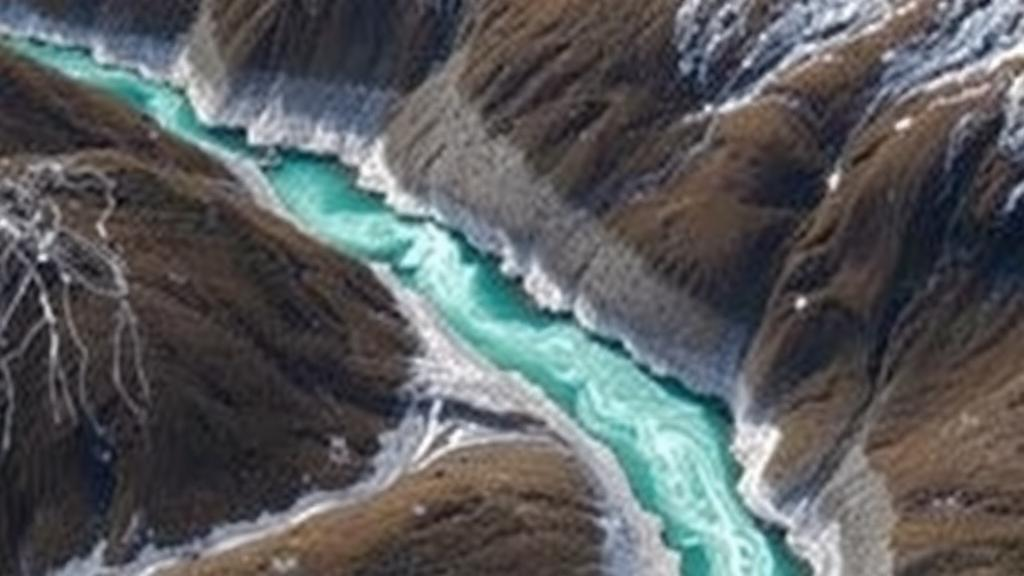
High in the Karakoram and Hindu Kush mountains, where the Gilgit River carves its way through some of the most inaccessible terrain on Earth, scientists face a deceptively simple question with enormous consequences: how much water will this river deliver next season, and how will that change as the climate warms? A new study published in Water Resources Management tackles that question in one of the world’s most data-starved river basins, and its findings suggest that a relatively simple hydrological model, fed entirely by satellite-derived and reanalysis data, may outperform far more complex tools in forecasting the fate of snow- and glacier-fed rivers.
The research, led by Rizwan Mansha and Muhammad Azmat of the National University of Sciences and Technology in Islamabad, together with colleagues in Pakistan, China, and Saudi Arabia, focused on the Gilgit River basin in Northern Pakistan. This catchment is a textbook example of what hydrologists call a sparsely gauged basin: a landscape where weather stations are few, far between, and often unreliable, yet where the river itself sustains communities downstream that depend on its flow for agriculture, hydropower, and daily life. In basins like this, conventional hydrological modeling is crippled at the first step, because models require continuous records of temperature, precipitation, and evapotranspiration that simply do not exist on the ground.
To circumvent the data drought, the team turned to remotely sensed and reanalysis products. They used daily temperature, precipitation, and evapotranspiration data from the European Centre for Medium-Range Weather Forecasts ERA-Interim reanalysis, a globally consistent dataset produced by assimilating observations into a physical model of the atmosphere. They supplemented this with daily solar radiation, wind speed, and relative humidity fields from the Coupled Model Intercomparison Project Phase 3 archive, the same multimodel dataset that underpinned major international climate assessments. The approach effectively replaces broken ground networks with a coherent, physically constrained picture of the atmosphere above the basin, delivered through a geographic information system framework that organizes the spatial data the models need.
With the forcing data in place, the researchers ran a head-to-head comparison of two widely used but structurally different hydrological models. The first was the Soil and Water Assessment Tool, or SWAT, a physically based, spatially distributed model that divides a watershed into sub-basins and further into hydrological response units, simulating processes such as infiltration, evaporation, snow accumulation and melt, and channel routing in considerable detail. The second was the HBV model, originally developed by the Swedish Meteorological and Hydrological Institute, a conceptual rainfall-runoff model that represents the catchment with a compact set of stores and routines, including a dedicated snow module, soil moisture accounting, and response functions that convert water into runoff.
The models were calibrated against thirteen years of observed daily streamflow from 1990 to 2002, and then validated against an independent five-year window from 2003 to 2007. The team evaluated performance using the Nash-Sutcliffe efficiency, a standard metric that measures how well simulated flows match observed ones relative to the mean of the observations, with a value of one indicating a perfect match, alongside the percent difference in total volume between simulated and observed flows. For the critical annual snowmelt season, HBV achieved a Nash-Sutcliffe efficiency of 0.93 during calibration with a volume difference of just 0.23 percent, and 0.75 with a volume difference of 26.30 percent during validation. SWAT recorded 0.60 and 34.26 percent during calibration, improving to 0.74 and 10.73 percent in validation.
Those numbers tell a nuanced story. Both models captured the broad rhythm of the basin’s hydrology, in which summer flow is dominated not by rain but by the melting of the winter snowpack and the slow release of water from glaciers. But HBV’s near-perfect calibration performance and its more consistent behavior across both periods suggest that its simpler structure, which depends on fewer parameters, is better suited to the peculiar hydrology of a cryosphere catchment when the only available inputs come from satellites and reanalysis. SWAT, with its many more parameters to constrain, appears more vulnerable to the uncertainties that pervade data-scarce mountain environments, where every parameter must be inferred from limited information.
Having established which model could be trusted, the researchers then used both to ask the question that matters most for the future: what happens to the river as the climate changes? Rather than relying on a single climate projection, they applied a systematic set of perturbations to the observed climate, shifting temperature across a range from minus two to plus four degrees Celsius and precipitation from minus ten to plus twenty percent. This scenario-based approach, sometimes called a sensitivity analysis, deliberately brackets the plausible future rather than betting on one trajectory, and it reveals how the basin’s hydrology responds to each driver independently.
The results were striking and, in places, sobering. Under the temperature scenarios, HBV projected annual streamflow changes ranging from a decrease of 16.92 percent at the coldest perturbation to a decrease of 6.6 percent at the warmest, while SWAT projected changes from minus 28.71 percent to minus 2.96 percent. For precipitation shifts, HBV indicated variations between minus 6.65 percent and 13.3 percent, and SWAT between minus 18.13 percent and 27.5 percent. The direction and magnitude of these responses reflect the delicate balance of a snow- and glacier-fed system: warmer temperatures alter the timing and volume of snowmelt, shifting the seasonal peak earlier and reducing the frozen storage that sustains summer flows, while changes in precipitation control how much snow accumulates in the first place. The divergence between the two models also carries a practical warning, because the choice of hydrological model can change the projected impact by a factor of several, meaning that model selection is not a technical footnote but a first-order source of uncertainty in water planning.
The broader significance of the study lies in its demonstration that meaningful hydrological assessment is possible in places where the traditional infrastructure of hydrology, the dense networks of rain gauges and stream gauges that underpin water management in wealthy countries, simply does not exist. By relying solely on remotely sensed and reanalysis data, the researchers showed that the Gilgit basin, and by extension hundreds of similar catchments across the Hindu Kush, Karakoram, and Himalaya region, can be brought within the reach of quantitative water resource planning. This matters because the region is often described as a water tower for Asia: the ice and snow stored in its mountains feed the Indus and other river systems on which hundreds of millions of people depend, and the region’s cryosphere is known to be changing, with glacier behavior varying dramatically from one valley to the next.
The authors position the work as a baseline for selecting appropriate hydrological models and datasets for hydrologically peculiar catchments, and they highlight the potential of HBV for operational use in data-scarce cryosphere environments. For water managers in Pakistan and across the greater Himalayan region, the message is twofold. First, the data needed to understand and forecast these rivers is already overhead, streaming down from satellites and reanalysis systems, waiting to be exploited. Second, when it comes to translating that data into reliable streamflow projections, the simplest tool that faithfully captures snow and glacier melt may be the most trustworthy guide through an uncertain climate future. As warming accelerates across the world’s high mountains, the basins that can least afford to be blind to their own hydrology may finally have a way to see.
Subject of Research: Comparative hydrological modeling of climate-induced streamflow variability in the snow- and glacier-fed Gilgit River basin using GIS-based SWAT and HBV models with remotely sensed data
Article Title: Climate-Induced Streamflow Variability Assessment Using GIS-Based Hydrological Models in a Snow-Glacier-Fed Sparsely Gauged River Basin
Article References: Mansha, R., Azmat, M., Arshad, M. Z., Tariq, A., Faqeih, K. Y., Alamri, S. M., & Alamery, E. R. (2026). Climate-Induced Streamflow Variability Assessment Using GIS-Based Hydrological Models in a Snow-Glacier-Fed Sparsely Gauged River Basin. Water Resources Management, 40(13), Article 535. https://doi.org/10.1007/s11269-026-04889-5
Image Credits: AI Generated
DOI: 10.1007/s11269-026-04889-5
Keywords: hydrological modeling, HBV, SWAT, streamflow, climate change, snowmelt, glacier-fed rivers, Gilgit River basin, remote sensing, ERA-Interim, Pakistan, water resources
Cite Scienmag News
Violet Maxwell. (October 12, 2026). Satellite Data and Simple Models May Hold the Key to Forecasting Rivers in the Frozen Himalayas. Scienmag. https://scienmag.com/satellite-data-and-simple-models-may-hold-the-key-to-forecasting-rivers-in-the-frozen-himalayas/
Violet Maxwell. "Satellite Data and Simple Models May Hold the Key to Forecasting Rivers in the Frozen Himalayas." Scienmag, 12 October 2026, https://scienmag.com/satellite-data-and-simple-models-may-hold-the-key-to-forecasting-rivers-in-the-frozen-himalayas/. Accessed 12 October 2026.
Violet Maxwell. "Satellite Data and Simple Models May Hold the Key to Forecasting Rivers in the Frozen Himalayas." Scienmag. October 12, 2026. https://scienmag.com/satellite-data-and-simple-models-may-hold-the-key-to-forecasting-rivers-in-the-frozen-himalayas/


