


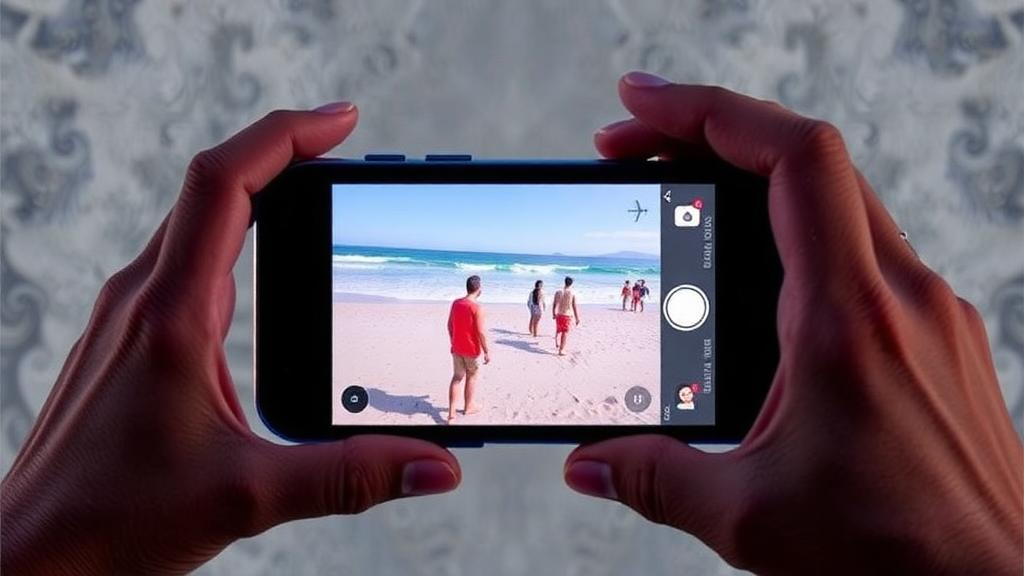
On a barrier island off the northern coast of Mexico’s Yucatan Peninsula, a pair of stainless steel smartphone cradles bolted to the Sisal Pier has quietly produced one of the most detailed records of beach behavior ever assembled for a tropical shoreline. The cradles are part of CoastSnap, a global citizen science program that invites anyone with a phone to photograph the coast from a fixed frame and upload the image through a mobile app. Researchers at the Universidad Nacional Autonoma de Mexico installed the two stations in May 2024, one facing the beach east of the pier and one facing west, and then spent more than a year testing whether snapshots from tourists and residents could match the precision of expensive surveying equipment. The answer, published in Environmental Monitoring and Assessment, is a resounding yes, and it comes with a bonus: the same photos reveal how people use the beach and how they feel about it.
The technical trick behind CoastSnap is photogrammetry. Because each phone rests in a cradle at a known position, elevation, and orientation, every crowd-sourced image can be georectified, meaning pixel coordinates are converted into real-world coordinates using a pinhole camera model. A projection matrix built from the camera’s intrinsic parameters, such as focal length and principal point, and its extrinsic parameters, including azimuth, tilt, and roll, transforms the oblique photo into a map. The remaining unknowns are solved with nonlinear least squares against ground control points, fixed objects with surveyed coordinates visible in the field of view. At Sisal, where the low elevation of the cradles and the constantly shifting shoreline made fixed points near the water impractical, the team improvised: they recorded videos of a person standing at multiple locations, extracted the frames, and combined them into a single control image that yielded temporary and virtual ground control points for both stations.
Once an image is rectified, an algorithm detects the waterline, the instantaneous boundary between wet and dry sand. Because that boundary moves with the tide, the raw waterline must be corrected to a standard vertical datum before different days can be compared. The researchers applied a linear tidal correction, dividing the tide level by a representative beach slope of about 0.1 to estimate the horizontal offset, and then validated the result the old-fashioned way. Over fourteen months they conducted 23 beach surveys along four cross-shore transects using a differential global positioning system in real-time kinematic mode, with elevations referenced to the MEX97 geoid. Comparing image-derived positions against these ground-truth measurements showed mean deviations between roughly 0.2 and 0.9 meters, with root-mean-square deviations of 1.8 to 3.5 meters depending on the transect. About 79 percent of tide-corrected shoreline estimates fell within three meters of the survey data, a level of accuracy consistent with previous CoastSnap studies worldwide.
Perhaps the most surprising technical finding concerns the tide correction itself. In this microtidal environment, where spring tides reach only 0.8 meters and waves are generally mild, correcting the waterline to the mean sea level datum improved accuracy only marginally. That result matters for coastal managers in tropical regions, because it suggests that on low-energy, gently sloping beaches the instantaneous waterline is already a serviceable proxy for shoreline position, simplifying the analysis pipeline considerably. It contrasts with studies on high-energy or macrotidal coasts, where tidal correction has proven essential. The Sisal results indicate that the dominant sources of error here lie elsewhere, in image rectification uncertainties, lighting conditions at sunrise and sunset, and the misplacement of phones in the cradle, which together forced the team to discard more than 45 percent of the uploaded images.
What the surviving images revealed about the beach itself is scientifically rich. The shoreline east and west of the pier behaved in strikingly different ways, a direct fingerprint of the structure’s influence on waves and sediment transport. Persistent sea breezes from the northeast drive a westward alongshore current and a littoral drift estimated at 30,000 to 90,000 cubic meters per year, so sand accumulates on the east side of the pier and starves the west side. The CoastSnap record captured subseasonal oscillations of 20 to 30 meters in beach width, resolved at half-meter spatial resolution along 250 meters of coast on each side of the pier, a combination of spatial and temporal detail that neither fortnightly GPS surveys nor satellite imagery can provide. The images even documented sand accreting near the pier on the west beach, evidence that the structure is partially permeable to sediment.
The network also caught a hurricane in the act. In October 2024, Hurricane Milton sent a northwest swell with significant wave heights up to 3.5 meters against the Yucatan coast. The image-derived shoreline showed a generalized retreat of 5 to 15 meters, most pronounced at the eastern transect, followed by a slow recovery over the following months. The west beach, sheltered by the pier’s shadow on wave energy, changed less and rebounded faster, regaining much of its width between November and March. Capturing both the storm impact and the recovery trajectory at daily resolution from photographs taken by ordinary beach visitors demonstrates exactly the kind of storm-scale monitoring that traditional programs struggle to afford, particularly in data-poor regions where infrastructure and funding constraints limit conventional instrumentation.
Participation itself became a subject of study. Over 457 days, the two stations collected 1,332 images, averaging 1.46 snapshots per day, a rate that placed Sisal among the top 15 CoastSnap stations globally during the study period. Uploads peaked on weekends, especially Saturdays and Sundays, and clustered in the late afternoon between 16:00 and 19:00 as visitors gathered to watch the sunset. Participation surged during holiday periods in July, August, December, and April, and unlike higher-latitude sites, where winter suppresses engagement, the tropical climate kept contributions flowing year-round. The researchers also observed a telling hiccup: when weathering degraded the QR code signage at the west station, uploads dropped until the sign was replaced in March 2025, after which participation quickly rebounded, a natural experiment showing how much the simple instruction panel matters.
The photos doubled as a social sensor. Users left 343 comments through the app, and a sentiment analysis using the VADER algorithm, adapted with local keywords such as litter, sargassum, and red tide to correct for gaps in the general lexicon, classified 54 percent of comments as positive, 12 percent as negative, and 34 percent as neutral. The most frequent word in the resulting word cloud was beautiful, yet litter appeared among the top ten most common terms, and sargassum and red tide ranked in the top fifteen. Commenters flagged plastic bottles, bags, and organic waste on the sand, complained about deteriorating pier infrastructure and modernized light poles, and voiced concern over accelerating coastal development, while others urged community clean-up campaigns. The analysis thus delivers a free, continuous read of public perception that would otherwise require costly surveys.
Beach occupancy emerged as a third data stream. Using the open-source software Fiji, the team manually counted beachgoers in the busiest image of each month, dividing frames into a grid and marking each person on the dry beach or in the water, with three independent operators to estimate uncertainty. Monthly maxima ranged from 56 to 414 visitors, with the record crowd of 414 plus or minus 10 people arriving on a Sunday in April 2025 during spring holidays. Occupancy consistently peaked on weekend afternoons during vacation periods regardless of season. Intriguingly, the number of daily image uploads correlated almost not at all with the number of people on the beach, with a correlation coefficient of just 0.031, meaning snapshot counts are a poor proxy for attendance even though the images themselves record it faithfully.
The Sisal experiment carries a broader message as CoastSnap expands past 700 stations in 40 countries. A few hundred dollars of steel cradles, a QR code, and a willing community can generate shoreline time series accurate to a few meters, resolve the local effects of coastal structures, document storm impacts and recovery, track crowds, and gauge public sentiment, all simultaneously and at essentially zero marginal cost per observation. The approach has limits, from discarded images and low camera elevations to the labor of manual counting, and the authors point to artificial intelligence and automated image registration as the next steps. But for the many tropical coastlines facing erosion, development pressure, and intensifying hurricanes without monitoring budgets to match, the evidence from Sisal suggests that some of the best coastal scientists may already be standing on the sand, phones in hand, waiting for the sunset.
Subject of Research: Citizen science monitoring of shoreline dynamics, beach use, and public perception at a tropical beach using the CoastSnap smartphone platform
Article Title: Assessing shoreline dynamics and beach use in a tropical beach: a citizen science-based approach using CoastSnap
Article References: Alonso-Hernández, L., Medellín, G., Torres-Freyermuth, A., & González-Celis, K. C. (2026). Assessing shoreline dynamics and beach use in a tropical beach: a citizen science-based approach using CoastSnap. Environmental Monitoring and Assessment, 198(10), Article 1061. https://doi.org/10.1007/s10661-026-15886-x
Image Credits: AI Generated
DOI: 10.1007/s10661-026-15886-x
Keywords: CoastSnap, citizen science, shoreline dynamics, coastal monitoring, Sisal, Yucatan, beach erosion, Hurricane Milton, photogrammetry, sentiment analysis, beach use, tropical coast
Cite Scienmag News
Violet Maxwell. (October 12, 2026). Beachgoers’ Smartphone Photos Turn a Mexican Beach Into a High-Resolution Coastal Lab. Scienmag. https://scienmag.com/beachgoers-smartphone-photos-turn-a-mexican-beach-into-a-high-resolution-coastal-lab/
Violet Maxwell. "Beachgoers’ Smartphone Photos Turn a Mexican Beach Into a High-Resolution Coastal Lab." Scienmag, 12 October 2026, https://scienmag.com/beachgoers-smartphone-photos-turn-a-mexican-beach-into-a-high-resolution-coastal-lab/. Accessed 12 October 2026.
Violet Maxwell. "Beachgoers’ Smartphone Photos Turn a Mexican Beach Into a High-Resolution Coastal Lab." Scienmag. October 12, 2026. https://scienmag.com/beachgoers-smartphone-photos-turn-a-mexican-beach-into-a-high-resolution-coastal-lab/


