


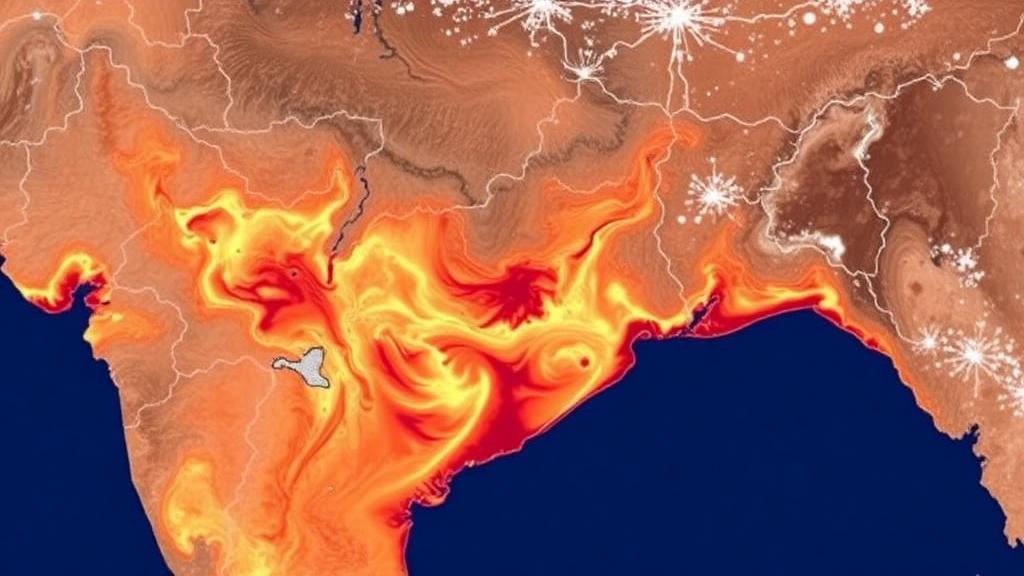
A rapidly growing city in northeastern India has become a laboratory for one of the most consequential processes of the twenty-first century: the transformation of living landscapes into hot, hard surfaces. A new study published in Environmental Science and Pollution Research has tracked Guwahati, the largest city in Assam, over thirty years of satellite observations and found that its average land surface temperature rose from 28.27 degrees Celsius in 1995 to 32.07 degrees Celsius in 2024. That increase of nearly four degrees, documented entirely from orbit, coincided with the expansion of built-up areas and a marked decline in vegetation and agricultural land across the city and its surroundings.
The research, led by Rajib Pegu of Sankardeva Mahavidyalaya with colleagues from institutions across Assam, Arunachal Pradesh, and New Delhi, harnessed the archival power of the Landsat program, which has been imaging the Earth’s surface since the 1970s. By processing multi-temporal Landsat imagery on the Google Earth Engine platform, a cloud-computing service that has revolutionized large-scale environmental analysis, the team was able to classify land cover and retrieve surface temperatures for multiple epochs spanning 1995 to 2024 without downloading or manually processing petabytes of raw data.
The technical pipeline behind the study reflects the current state of the art in remote sensing. Land use and land cover maps were generated using a Random Forest classifier, a machine learning algorithm that builds hundreds of decision trees from training samples and votes on the most probable class for each pixel. Random forest classification has become a workhorse of land cover mapping because it handles noisy, high-dimensional satellite data robustly and resists overfitting. For temperature retrieval, the researchers turned to the radiative transfer approach, converting the thermal infrared radiation measured by Landsat’s sensors into true land surface temperature, with corrections for atmospheric effects and for the emissivity of different surfaces, which they estimated using the Normalized Difference Vegetation Index, a standard proxy for vegetation density.
Land surface temperature is not the same as the air temperature reported by weather stations. Satellites measure the radiative skin of the ground itself: rooftops, asphalt, bare soil, crop fields, forest canopies, and water. Because these surfaces absorb and release heat very differently, land surface temperature is an extraordinarily sensitive indicator of what a landscape is made of. Dark, impervious materials like asphalt and concrete absorb solar radiation during the day and re-emit it slowly, while vegetated surfaces cool themselves through evapotranspiration, the process by which plants release water vapor and shed heat. Water bodies, with their enormous heat capacity, remain the coolest surfaces of all.
The Guwahati data bore this physics out with striking clarity. Built-up areas recorded the highest mean surface temperature of any land cover class, at 36.11 degrees Celsius, while water bodies registered the lowest at 27.29 degrees Celsius, a gap of nearly nine degrees across the same city on the same days. This thermal stratification is the surface signature of the urban heat island effect, the phenomenon first described by Luke Howard in London in the early nineteenth century and quantified for modern cities by climatologist T. R. Oke in the 1970s. What makes the Guwahati study notable is that it documents this effect unfolding in a mid-sized city of the Global South, where urban growth is fastest and adaptive capacity is often thinnest.
To establish that the warming was real and not an artifact of a few unusually hot years, the team applied the Mann-Kendall trend test, a non-parametric statistical method that detects monotonic trends in time series without assuming any particular distribution, together with Sen’s slope estimator, which provides a robust measure of the magnitude of change. The result was a statistically significant warming trend at the conventional p-value threshold of 0.05, confirming that Guwahati’s surface has been heating steadily across the three-decade record rather than merely fluctuating.
The statistical core of the study came from a pixel-level analysis of the 2024 dataset. The researchers drew 5000 randomly sampled pixels and examined how vegetation greenness, expressed through the NDVI, related to surface temperature. Pearson’s correlation analysis revealed a significant inverse relationship, with a correlation coefficient of negative 0.492, meaning that greener pixels were systematically cooler. Linear regression showed that vegetation alone explained approximately 24.2 percent of the spatial variability in surface temperature, a substantial fraction given how many other factors, from elevation to soil moisture to building geometry, also shape the thermal landscape. A one-way analysis of variance confirmed that temperature differences among land cover classes were highly significant, with a p-value below 0.001.
These numbers carry a message that extends well beyond one Indian city. Guwahati sits at the gateway to Northeast India, a region of extraordinary biodiversity, and its growth mirrors that of hundreds of secondary cities across Asia and Africa where urban expansion is consuming wetlands, farmland, and forest fringes. Previous work on Guwahati had already flagged declining groundwater levels and shifting heat island patterns, and studies from Pune, Jaipur, Delhi, Mumbai, and the East Kolkata Wetlands have documented similar dynamics. The new study adds a rigorous, three-decade quantitative baseline that links landscape change to thermal change in a single coherent framework.
The implications for planning are direct. Because vegetation explains roughly a quarter of the spatial variation in surface temperature, protecting and expanding urban green cover is not merely an aesthetic preference but a measurable cooling strategy. The authors point to the conservation of urban vegetation, wetlands, and other natural landscapes as priorities, and frame their findings as evidence for climate-responsive urban planning aligned with the United Nations Sustainable Development Goals on sustainable cities, climate action, and life on land. In a warming century, the coolest surfaces a city owns are the ones it has not yet paved.
The study also demonstrates how the tools of planetary observation have been democratized. A team of researchers at regional Indian institutions, using free Landsat archives and the Google Earth Engine platform, produced an analysis that would once have required a supercomputing facility and a large budget. As urbanization accelerates across the Global South, this kind of accessible, reproducible satellite monitoring offers city governments a way to see, in near real time, the thermal consequences of every hectare of green space lost, and every hectare of concrete gained.
Subject of Research: The relationship between land use land cover change and land surface temperature dynamics in Guwahati, India, analyzed with Landsat imagery and Google Earth Engine
Article Title: Urbanization-driven thermal changes: a remote sensing approach to land surface temperature (LST) and land use land cover (LULC) dynamics in Guwahati, Assam, India
Article References: Pegu, R., Mazumder, T., Borah, H., Bora, K., & Hazarika, P. (2026). Urbanization-driven thermal changes: a remote sensing approach to land surface temperature (LST) and land use land cover (LULC) dynamics in Guwahati, Assam, India. Environmental Science and Pollution Research, 33(28), 14266-14281. https://doi.org/10.1007/s11356-026-38169-x
Image Credits: AI Generated
DOI: 10.1007/s11356-026-38169-x
Keywords: land surface temperature, land use land cover change, urban heat island, Guwahati, remote sensing, Landsat, Google Earth Engine, random forest classification, NDVI, urbanization, Mann-Kendall test, Assam
Cite Scienmag News
Violet Maxwell. (October 11, 2026). Satellite Data Reveals Guwahati’s Surface Temperatures Climbed Nearly Four Degrees in Three Decades. Scienmag. https://scienmag.com/satellite-data-reveals-guwahatis-surface-temperatures-climbed-nearly-four-degrees-in-three-decades/
Violet Maxwell. "Satellite Data Reveals Guwahati’s Surface Temperatures Climbed Nearly Four Degrees in Three Decades." Scienmag, 11 October 2026, https://scienmag.com/satellite-data-reveals-guwahatis-surface-temperatures-climbed-nearly-four-degrees-in-three-decades/. Accessed 11 October 2026.
Violet Maxwell. "Satellite Data Reveals Guwahati’s Surface Temperatures Climbed Nearly Four Degrees in Three Decades." Scienmag. October 11, 2026. https://scienmag.com/satellite-data-reveals-guwahatis-surface-temperatures-climbed-nearly-four-degrees-in-three-decades/


