


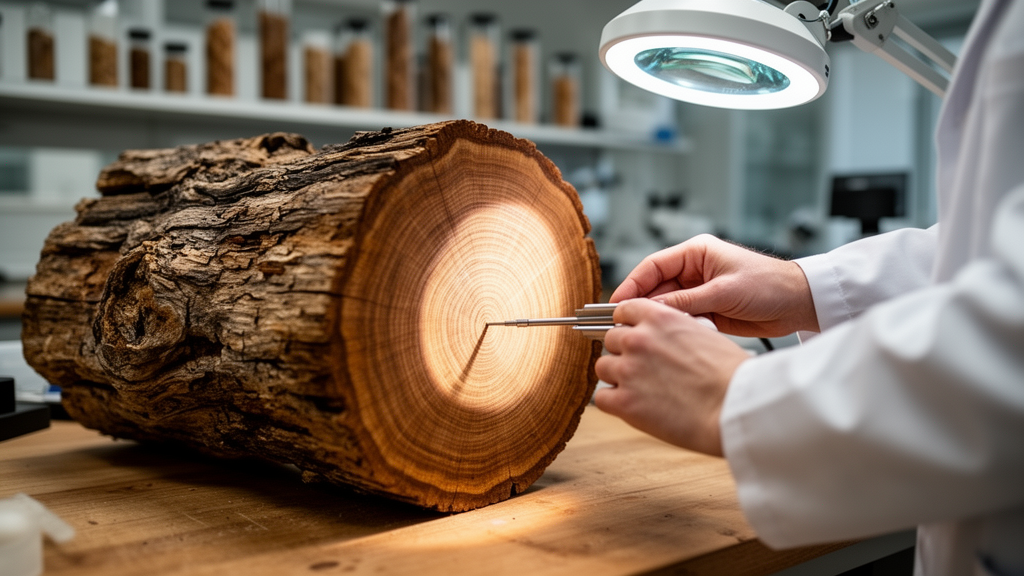
Tree rings have long served as one of science’s most reliable time machines, preserving an annual record of the moisture conditions under which ancient trees grew. But a new study published in Advances in Statistical Climatology, Meteorology and Oceanography shows that these wooden archives contain far more information than scientists typically extract from them. A team led by Kate Marvel of NASA’s Goddard Institute for Space Studies, working with Benjamin Cook, Ensheng Weng, Ram Singh, and Edward Cook, has developed a fully Bayesian inverse method that converts tree-ring-based drought reconstructions into joint probabilistic estimates of monthly temperature and precipitation stretching back a full millennium. The results are striking: the 1930s emerge as likely the driest decade on record in central Kansas, while the late twentieth century appears to have been the wettest period in the North American southwest since at least the year 1000.
The innovation lies in what the researchers chose to work with. Widely used drought atlases, including the North American Drought Atlas, generally target a single variable: the summer Palmer Drought Severity Index, a measure of soil moisture that reflects a complex mixture of meteorological conditions. The index responds not only to rainfall but also to evapotranspiration, which depends on temperature, humidity, wind speed, and radiation, and it integrates conditions over the preceding year or more. That complexity, the team realized, is an opportunity rather than a limitation. Because the Palmer index is shaped by both temperature and precipitation, the reconstructed values published in the drought atlas can be mathematically inverted to infer the underlying meteorology, albeit with considerable uncertainty that must be handled rigorously.
To do this, the researchers built a hierarchical Bayesian model with three components. First, they estimated a forward model describing how the Palmer index responds to monthly temperature and precipitation, including a lag term capturing soil moisture memory, so that a dry year tends to be followed by another dry year. Second, they learned a prior distribution on the 24-dimensional vector of monthly temperatures and precipitation, spanning September through August, that captures the observed covariance structure between these variables. Third, they combined these elements to compute a full posterior distribution for unobserved past climate. The prior was constructed with an LKJ distribution on the covariance matrix, and the model was fitted using the PyMC probabilistic programming framework with the No-U-Turn Sampler, an adaptive variant of Hamiltonian Monte Carlo.
One unavoidable complication is that all modern weather occurs against the backdrop of rapid global warming. Because current global temperatures are unprecedented in the instrumental record, the basic assumption of most learning models, that training data resembles validation data, breaks down. The team addressed this by assuming that regional monthly temperatures and precipitation scale with global mean temperature, using the GISS Surface Temperature Analysis to estimate the anomaly. Over the reconstruction period, where no instrumental global temperature exists, they treated last-millennium global temperature as a random variable with a distribution informed by the variability of the detrended twentieth-century record. This allowed the model to separate the forced warming response from internal variability when learning what past climate might have looked like.
The three study locations were chosen deliberately, each a hotspot of past drought activity with a distinct precipitation climatology. Dodge City, Kansas, sits at the heart of the Dust Bowl, where rain falls mainly in spring and summer. Red Mesa, Arizona, near the Four Corners region, is the epicenter of historical megadrought activity, with precipitation spread more evenly through the year. Sonora Junction, California, in the Sierra Nevada, receives almost all its precipitation in winter. The fitted forward model revealed these differences clearly: in Kansas, high summer drought index values were robustly associated with cool, wet springs and summers; in Arizona, the index was more sensitive to fall and winter precipitation; and in California, winter rainfall and even small amounts of June rain strongly influenced the index, while the previous year’s conditions mattered little.
Validation against the CRU TS instrumental dataset showed the method performs well, especially for precipitation. Correlations between the posterior mean reconstruction and observations over the validation period reached 0.72 for Dodge City, 0.72 for Sonora Junction, and 0.78 for Red Mesa. The reconstruction captured the Dust Bowl drought in Kansas better than the multi-proxy Last Millennium Reanalysis, and instrumental precipitation values fell within the reconstructed likely range for most years. Temperature proved harder: correlations of 0.54, 0.31, and 0.4 across the three sites reflected the simple fact that the growing-season Palmer index is far more sensitive to rainfall than to temperature. The method still showed some skill, shifting posterior temperatures toward higher values during the scorching 1930s, even if it could not capture the full magnitude of the extreme heat.
The probabilistic framework also enables something deterministic reconstructions cannot: statements about the odds that particular years or decades were the most extreme in a thousand years. By generating 4000 realizations of the posterior and concatenating them with instrumental data, the team calculated the probability that any given year was the wettest or driest on record. In Kansas, the year 1522 was the most likely driest year of the millennium, with a 13 percent probability, while 1913, the driest year in the instrumental record, had a 23 percent chance of being the driest since at least 1000. In Arizona, there was only a 0.05 percent chance the driest year occurred after 1901, with candidates including 1748, 1685, 1729, and 1542. In California, the driest year most likely fell in 1580, 1053, 1729, or 1126.
The decade-scale results carry the most dramatic implications. There is a 71 percent probability that 1931 to 1940 was the driest decade on record in central Kansas, confirming the Dust Bowl as a hydroclimatic event essentially without precedent in the past millennium. Meanwhile, the late twentieth century stands out on the wet end of the distribution: a 15 percent chance that 1992 to 2001 was the wettest decade in Kansas, and a 31 percent chance that 1979 to 1988 was the wettest decade in the Arizona region. These findings reinforce recent work identifying an extraordinary late twentieth-century pluvial in the American southwest, a wet episode that may have masked the onset of the aridification now underway.
The study also exposes an important limitation with implications for climate risk assessment. Over the training period of 1950 to 2005, the Kansas region simply did not experience hot droughts of the kind that struck in 1934, when record-shattering heat accompanied extreme precipitation deficits. The 1956 drought brought similarly low summer rainfall, but average summer temperatures were 1.67 degrees Celsius colder than in 1934. Because tree-ring drought records from the late twentieth century are relatively insensitive to temperature, a model trained on that era will systematically fail to capture combined heat and drought extremes, precisely the compound events that pose the greatest dangers in a warming world.
The authors emphasize that their method is designed to complement, not replace, existing reconstruction techniques that assimilate multiple proxies or rely on climate model priors. Because it is fully Bayesian, the framework can be updated as new data arrive and extended to incorporate greater complexity, such as autoregressive or Gaussian process models of internal variability, or independent reconstructions of global mean temperature. For now, the study demonstrates how much hidden information can be coaxed from a single, familiar dataset. The rings of centuries-old trees, it turns out, were quietly recording not just drought, but the temperature and rainfall combinations that produced it, waiting for the right statistical tools to set them free.
Subject of Research: Bayesian reconstruction of last-millennium temperature and precipitation from tree-ring-based drought atlas data
Article Title: Joint probabilistic estimates of temperature and precipitation from tree ring-based reconstructions of the last millennium
Article References: Marvel, K., Cook, B., Weng, E., Singh, R., & Cook, E. (2026). Joint probabilistic estimates of temperature and precipitation from tree ring-based reconstructions of the last millennium. Advances in Statistical Climatology, Meteorology and Oceanography, 12(1), 43-57. https://doi.org/10.5194/ascmo-12-43-2026
Image Credits: AI Generated
Keywords: tree rings, paleoclimate, Bayesian inference, drought, Palmer Drought Severity Index, North American Drought Atlas, Dust Bowl, precipitation reconstruction, temperature reconstruction, last millennium, megadrought, climate variability
Cite Scienmag News
Sloane Callahan. (October 9, 2026). Tree Rings and Bayesian Statistics Reveal a Millennium of Hidden Climate Extremes. Scienmag. https://scienmag.com/tree-rings-and-bayesian-statistics-reveal-a-millennium-of-hidden-climate-extremes/
Sloane Callahan. "Tree Rings and Bayesian Statistics Reveal a Millennium of Hidden Climate Extremes." Scienmag, 9 October 2026, https://scienmag.com/tree-rings-and-bayesian-statistics-reveal-a-millennium-of-hidden-climate-extremes/. Accessed 9 October 2026.
Sloane Callahan. "Tree Rings and Bayesian Statistics Reveal a Millennium of Hidden Climate Extremes." Scienmag. October 9, 2026. https://scienmag.com/tree-rings-and-bayesian-statistics-reveal-a-millennium-of-hidden-climate-extremes/


