


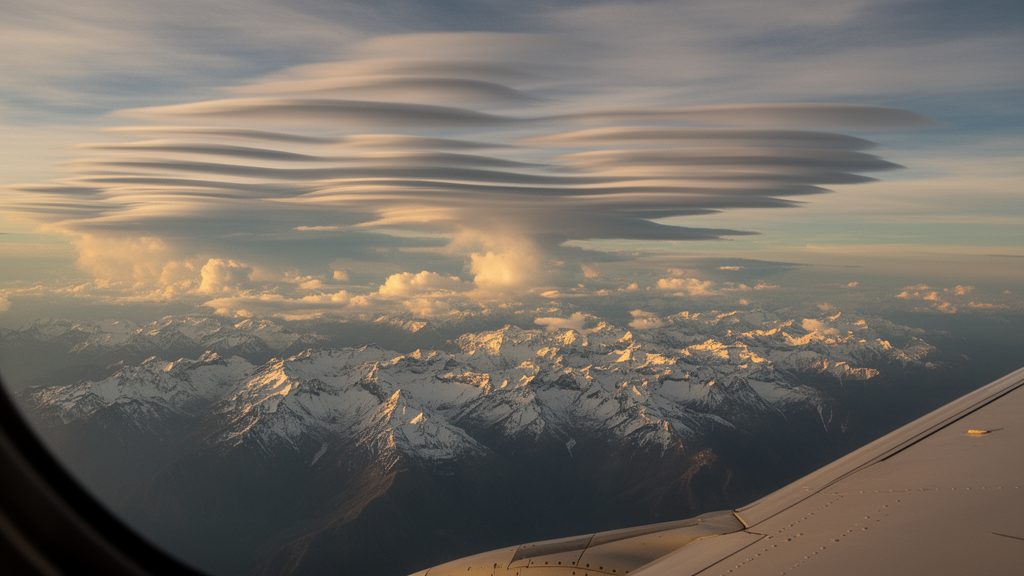
High above the world’s great mountain ranges, invisible waves of air can snap an aircraft’s calm cruise into chaos within seconds. This phenomenon, known as mountain wave turbulence, forms when strong winds slam into steep terrain and are deflected upward, spawning gravity waves that grow, steepen and finally break as they reach the thin air near the tropopause, the boundary between the troposphere and the stratosphere some 9 to 17 kilometres above the surface. That altitude is precisely where airliners cruise, and it is a phase of flight during which passengers and crew frequently do not have their seatbelts fastened. Unlike turbulence embedded in deep convective clouds, mountain wave turbulence is invisible to onboard radar, striking with little or no warning. A new study published in the journal Weather and Climate Dynamics now offers the most detailed global picture yet of how this hazard will shift as the planet warms, and its findings are strikingly uneven across the map.
The research, led by Isabel H. Smith of the University of Reading, together with Paul D. Williams and Reinhard Schiemann, quantifies changes in moderate-or-greater mountain wave turbulence by 2050 under a high-end warming scenario. The team used a multi-model approach built on the high-resolution tier of the Coupled Model Intercomparison Project, known as HighResMIP, which was designed to close the gap between climate models and numerical weather prediction. After testing seven horizontal grid spacings across three global climate models, the authors settled on three of the finest: HadGEM3-GC3.1-HM at 25 kilometres, EC-Earth-3P-HR at 36 kilometres and MPI-ESM1.2-XR at 34 kilometres. The choice mattered. In their comparison of the 1950s with the 2040s, coarser models with grid spacings of 60 kilometres or more failed to resolve many known turbulence zones altogether, a consequence of smoothed topography and terrain gradient thresholds that erase the steep slopes where mountain waves are born.
Diagnosing turbulence in climate model output is an art of proxies. Because the models cannot simulate turbulent eddies directly at these scales, the researchers applied six established clear-air turbulence indices, including horizontal temperature gradient, frontogenesis function, wind divergence, wind speed, flow deformation and a combined flow deformation and wind speed measure. Each index was then multiplied by a terrain-dependent factor requiring surface heights above 200 metres, terrain gradients steeper than 0.5 kilometres per metre and sufficient low-level wind speed below one kilometre. This construction, validated in earlier work against pilot reports, effectively isolates turbulence generated by mountains. The team defined moderate-or-greater turbulence as the 98th percentile of each index at the 200 hectopascal pressure level, roughly the cruising altitude of jet aircraft, and only accepted trends that passed a 95 percent confidence test in a linear regression over the 101-year period from 1950 to 2050.
The headline result is a world divided. The largest increase in mountain wave turbulence is projected over the Antarctic, where the average trend reaches 0.52 percent per year, equivalent to roughly 52 percent more turbulence over the century, with the strongest seasonal rise of 0.31 percent per year in the Southern Hemisphere summer. Greenland follows closely, a finding with direct consequences for the busy transatlantic corridors that cross its southern slopes. Regions covering Georgia, Azerbaijan and eastern Turkey, along with parts of Chile and Argentina in the southern Andes, also show significant increases. In contrast, the Alps, the Atlas Mountains and the northern and central Andes are projected to become calmer, as are broad swaths of Africa. The study’s sub-continental analysis across 28 regions reveals that even within a single continent the picture can reverse: North America as a whole gains turbulence, yet the zone covering the Rocky Mountains loses it in every season, with a decline of more than 50 percent in spring, the greatest decrease found anywhere in the study.
Seasonality emerges as a critical dimension of the projections. Over North America, winter and autumn carry the strongest increases, consistent with the known climatology in which lowered tropopause heights and peak westerly winds crossing mountain ranges perpendicularly favour wave generation. The region encompassing Greenland, Iceland and northeastern Canada shows increases of 18.2 percent in summer, 16.2 percent in autumn, 11.1 percent in spring and 7.4 percent in winter by 2050. Over Asia, home to the Himalayas and the Tibetan Plateau, the models project more turbulence in winter but less in summer, with trends of 0.023 and minus 0.014 percent per year respectively. Australia displays a particularly sharp seasonal split, with significant declines in the southern summer and autumn but unanimous increases across all models and indices in winter and spring. The Antarctic is most turbulent in Southern Hemisphere winter and least so in summer, yet both seasons show rising trends.
The mechanism behind these shifts appears to lie substantially in the winds near the surface. Mountain waves draw their energy from low-level airflow, so any change in wind speed over terrain directly modulates wave amplitude and the likelihood of breaking. The study found a positive correlation between projected changes in turbulence and changes in 10-metre wind speed, examining both average and maximum winds to capture the general trend and the occurrence of extreme gusts. In the Antarctic, increases in turbulence in both summer and winter were linked to strengthening average and maximum low-level winds, a finding that echoes observational work by the British Antarctic Survey showing surface winds there have strengthened by about 15 percent since 1980. Over Canada and Alaska, rising turbulence tracked increasing winds, while the decline over the Rockies in autumn was associated with weakening maximum wind speeds, and the drop over India and Sri Lanka followed a decrease in average low-level winds.
These results complicate a simpler narrative from earlier research. Previous studies of clear-air turbulence, which is driven largely by shifting and strengthening jet streams, have consistently projected global increases under warming, and a 2023 analysis of mountain wave turbulence using coarser models found increases over roughly two-thirds of the globe, concentrated in the mid-to-high latitudes. The new high-resolution work partially confirms that latitudinal pattern but adds important exceptions, notably the declines over the Rockies and the northern and central Andes, which sit outside the tropical band where weakening was expected. The authors attribute some of the divergence to terrestrial stilling, the observed and projected slowing of surface winds across many Northern Hemisphere mid-latitude regions, which suppresses the raw energy available to generate mountain waves even as upper-level dynamics change.
The study is candid about its limitations. Climate model topography remains smoother than reality, so some known turbulence hotspots in the western United States are not fully captured, and mountain wave turbulence often develops downstream of ranges in ways that fixed terrain-gradient thresholds may miss. All projections assume the high-end SSP8.5 emissions scenario with little mitigation, so the changes described represent an upper bound rather than a central expectation. Index choice also matters: over South America, one index placed turbulence changes in a range of 0 to 50 percent while another suggested 180 to 250 percent, a spread the authors view as complementary rather than contradictory, since different diagnostics capture different generation mechanisms. Averaging across models and indices can also mask disagreement, as occurred over the Himalayas, where one model’s significant increase outweighed two smaller declines.
For the aviation industry, the practical message is one of targeted vigilance rather than uniform worsening. Turbulence already costs airlines millions of dollars a year in delays, injuries and structural damage, and pilot reports, the traditional observational record, carry median position uncertainties of around 50 kilometres. The new projections suggest airlines serving polar and subpolar routes, particularly those crossing Greenland or the few routes over the Antarctic, should anticipate a measurably rougher atmosphere by mid-century, while carriers over the Alps, the Atlas and the northern Andes may face somewhat reduced exposure. As high-resolution climate models continue to close the gap with weather forecasting systems, studies of this kind are turning an invisible, radar-proof hazard into something that can at least be mapped in advance, giving flight planners and meteorologists a decades-long head start on the turbulence of tomorrow.
Subject of Research: Projected global changes in mountain wave aviation turbulence under climate warming
Article Title: Global shifts in mountain wave turbulence within high resolution climate models
Article References: Smith, I. H., Williams, P. D., & Schiemann, R. (2026). Global shifts in mountain wave turbulence within high resolution climate models. Weather and Climate Dynamics, 7(3), 1733-1758. https://doi.org/10.5194/wcd-7-1733-2026
Image Credits: AI Generated
Keywords: mountain wave turbulence, aviation safety, climate change, HighResMIP, CMIP6, clear-air turbulence, gravity waves, Greenland, Antarctic, Rocky Mountains, terrestrial stilling, climate models
Cite Scienmag News
Sloane Callahan. (October 9, 2026). Climate Change Is Redrawing the Map of Dangerous Mountain Wave Turbulence for Aviation. Scienmag. https://scienmag.com/climate-change-is-redrawing-the-map-of-dangerous-mountain-wave-turbulence-for-aviation/
Sloane Callahan. "Climate Change Is Redrawing the Map of Dangerous Mountain Wave Turbulence for Aviation." Scienmag, 9 October 2026, https://scienmag.com/climate-change-is-redrawing-the-map-of-dangerous-mountain-wave-turbulence-for-aviation/. Accessed 9 October 2026.
Sloane Callahan. "Climate Change Is Redrawing the Map of Dangerous Mountain Wave Turbulence for Aviation." Scienmag. October 9, 2026. https://scienmag.com/climate-change-is-redrawing-the-map-of-dangerous-mountain-wave-turbulence-for-aviation/


