


Deep in the atmosphere, there is a greenhouse gas so persistent that a single molecule released today will still be trapping heat when the next ice age has come and gone. Tetrafluoromethane, known to climate scientists as CF4 or PFC-14, has an atmospheric lifetime of roughly 50,000 years and a 100-year global warming potential of 7,380, according to the IPCC’s Sixth Assessment Report. Unlike carbon dioxide, it does not come from cars, power plants, or farms. Its dominant anthropogenic source is a single, highly specific industrial event: the anode effect in primary aluminium smelting, an occasional electrical malfunction in the enormous reduction cells where alumina is converted into liquid metal. And yet, despite this remarkably precise origin story, the gridded emission inventories that atmospheric scientists rely on have historically placed CF4 emissions not where the smelters are, but where the people are.
That mismatch is the target of a new open dataset published in Earth System Science Data Discussions by independent researcher Zach Dissington. The work, currently under peer review, presents a global registry of the world’s primary aluminium smelters operating in 2020 — 94 facilities spread across 36 countries, catalogued in 95 registry rows with coordinates, nameplate capacity, operating status, and per-row source notes. From this registry, the study derives a set of gridded relative-weight fields designed to serve as the aluminium-sector component of a spatial prior in atmospheric inversion models, the statistical frameworks used to work backwards from measured atmospheric concentrations to actual emission locations and magnitudes.
The logic behind the approach is disarmingly simple. Smelters are a finite, public, mappable set of industrial facilities. There is no mystery about where aluminium is produced: the plants are enormous, conspicuous, and documented by national statistics agencies and industry associations alike. Distributing a smelter-specific gas by population density, as many existing inventories effectively do through built-up-area and population proxies, is a category error that the new dataset aims to correct. The registry is accompanied by ready-to-use gridded maps in three variants — capacity-weighted, presence-only, and production-rescaled — at 1-degree resolution globally and 0.1 degrees over Europe, formatted for direct ingestion into inversion workflows and inventory disaggregation schemes.
Validation of the registry against independent data shows encouraging consistency. Registry capacity tracks United States Geological Survey national production estimates within roughly 25 percent in every listed producing country, with one glaring exception: China. The Chinese aluminium industry is vast and fragmented, and the registry handles it with 12 registered cluster-anchor plants standing in for a fleet of roughly 120 smelters. For China, the production-rescaled variant rescales the national total rather than attempting to resolve placement within the country — an honest acknowledgment of the limits of open-source facility mapping in a sector where plant-level data is harder to verify.
The real test, however, is whether the smelter-based maps actually improve the placement of CF4 emissions in the eyes of the atmosphere itself. To find out, the study compared the smelter field against the EDGAR v8.0 baseline — the standard European emission inventory — using an observation-driven posterior ensemble from the ICOS 2020 European CF4 analysis, generated with a flat prior under the RHIME inversion system. The results are nuanced but telling. In Iceland, home to power-hungry smelters fed by geothermal and hydroelectric energy and essentially devoid of other plausible CF4 sources, the smelter field correlated with the posterior better than the EDGAR baseline, scoring 0.25 versus 0.00, a difference that was statistically significant under spatial tests in both single-system ensemble members covering the island.
Across the pooled group of European smelter countries, the smelter field performed directionally better in five of the six ensemble members, suggesting a consistent if not always decisive advantage. But the comparison is not a clean sweep. France significantly favoured the EDGAR baseline in the same two members that favoured the smelter field over Iceland, and Norway, Spain, and the United Kingdom were all EDGAR-favoured in the evaluation. These mixed results reflect the inherent difficulty of the problem: CF4 emissions are small in absolute terms, atmospheric measurements are sparse, and inversion posteriors carry their own uncertainties. Where the measurements can clearly distinguish between the two spatial hypotheses — as in Iceland — the smelter map wins. Where they cannot, the outcome depends on the details of the inversion setup.
One finding from the evaluation is particularly striking. EDGAR assigns exactly zero CF4 emissions to 15 of the 22 European smelter cells in the analysis domain. In other words, for the majority of grid cells containing active aluminium smelters in Europe, the standard inventory places no aluminium-sector CF4 at all, presumably distributing the national totals elsewhere or omitting them entirely. For any inversion system trying to reconcile measured atmospheric CF4 with reported emissions, that kind of structural misplacement can bias the inferred emission estimates in ways that are difficult to diagnose. A prior that at least puts the weight where the facilities are gives the inversion a fighting chance of finding the right answer.
The author is careful to frame what the dataset is and, just as importantly, what it is not. The gridded fields are relative weights for a single sector, not emissions estimates in themselves. They tell an inversion model how to distribute a known or hypothesised aluminium-sector total across space; they do not say how much CF4 the world’s smelters actually emit in any given year. The paper’s sixth section lays out the workflow and the cautions required to use the fields correctly, an unusually transparent treatment of the assumptions baked into spatial priors — assumptions that are often hidden inside large inventory products and rarely examined by end users.
The significance of getting CF4 right extends well beyond the aluminium sector. Because the gas persists for 50,000 years, every tonne emitted is effectively a permanent addition to the atmospheric greenhouse burden on any timescale relevant to human civilisation. Global CF4 concentrations have been rising steadily since the mid-twentieth century, and while the anode effect can be reduced through better process control and emerging inert-anode technologies, the emissions already released will outlast every institution that recorded them. Accurate attribution of ongoing emissions is therefore a prerequisite for both scientific accountability and any future policy that treats perfluorocarbons with the seriousness their longevity demands.
The dataset itself, archived on Zenodo under a CC-BY-4.0 license alongside accompanying model code and software, represents a quiet but meaningful shift in how emission inventories for industrial gases might be built. Instead of relying on population proxies that smear a point-source gas across cities, the registry approach starts from the physical reality of the emitting infrastructure and builds outward. It is a method that could in principle extend to other sector-specific gases with well-defined facility footprints. For now, it gives atmospheric scientists something they have long lacked for CF4: an open, verifiable, smelter-resolved map of where the world’s aluminium — and its most permanent greenhouse gas — actually comes from. Whether the inversion community adopts it widely will depend on further validation, but the direction of travel is clear: when a gas has a factory address, the map should know it.
Subject of Research: An open global registry of primary aluminium smelters used to derive gridded spatial priors for CF4 (PFC-14) greenhouse gas emissions in atmospheric inversions.
Article Title: An open global registry of primary-aluminium smelters and a derived gridded spatial prior for CF4 (PFC-14) emissions
Article References: Dissington, Z. (2026). An open global registry of primary-aluminium smelters and a derived gridded spatial prior for CF 4 (PFC-14) emissions. https://doi.org/10.5194/essd-2026-480
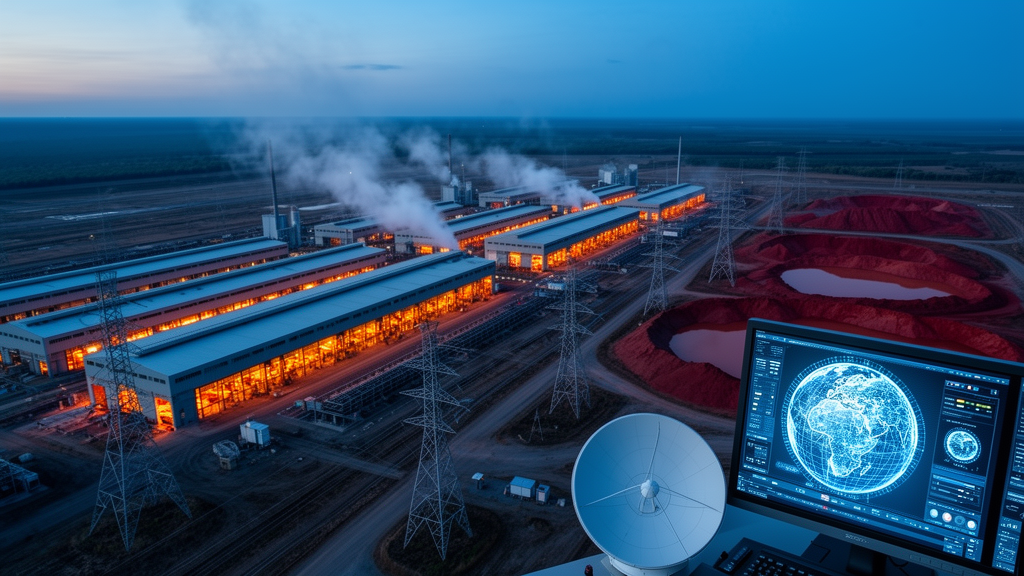
Image Credits: AI Generated
Keywords: CF4, PFC-14, tetrafluoromethane, aluminium smelters, greenhouse gases, emission inventories, atmospheric inversion, EDGAR, spatial priors, anode effect, Earth System Science Data, open dataset
Cite Scienmag News
Violet Maxwell. (October 8, 2026). New Global Map Tracks the World’s Aluminium Smelters to Pinpoint a 50,000-Year Greenhouse Gas. Scienmag. https://scienmag.com/new-global-map-tracks-the-worlds-aluminium-smelters-to-pinpoint-a-50000-year-greenhouse-gas/
Violet Maxwell. "New Global Map Tracks the World’s Aluminium Smelters to Pinpoint a 50,000-Year Greenhouse Gas." Scienmag, 8 October 2026, https://scienmag.com/new-global-map-tracks-the-worlds-aluminium-smelters-to-pinpoint-a-50000-year-greenhouse-gas/. Accessed 8 October 2026.
Violet Maxwell. "New Global Map Tracks the World’s Aluminium Smelters to Pinpoint a 50,000-Year Greenhouse Gas." Scienmag. October 8, 2026. https://scienmag.com/new-global-map-tracks-the-worlds-aluminium-smelters-to-pinpoint-a-50000-year-greenhouse-gas/


