


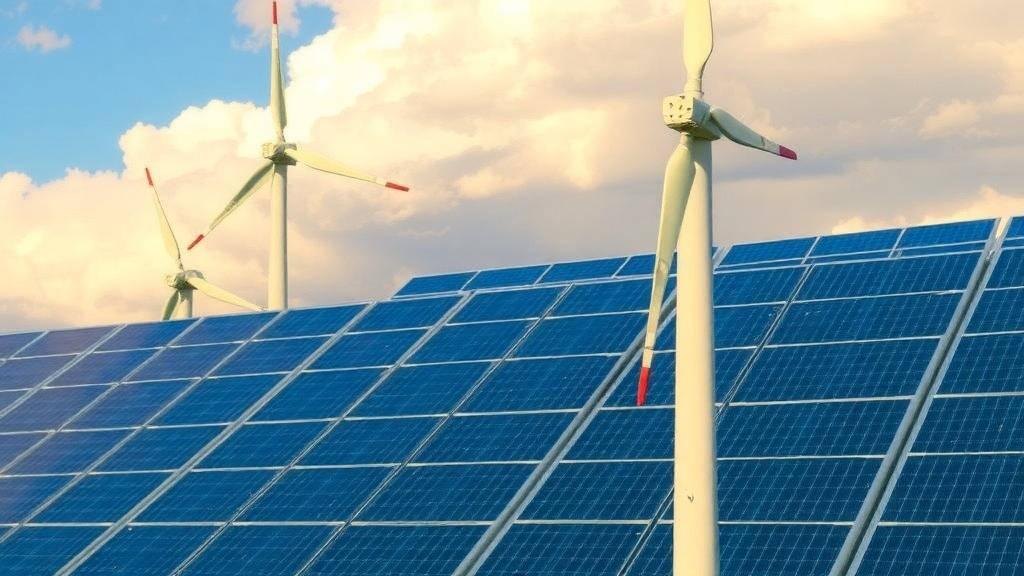
Every wind turbine and solar panel in Europe sits at the mercy of the atmosphere, and for grid operators, investors and national planners, the question of what the weather will do over the next few years is no longer academic. A new study published in Earth System Dynamics by Sara Moreno-Montes of the Barcelona Supercomputing Center and colleagues provides the most detailed assessment yet of whether decadal climate predictions — forecasts that look three years ahead — can actually deliver usable information about Europe’s wind and solar resources. The answer is a striking split: solar energy emerges as remarkably predictable across much of the continent, while wind power remains stubbornly elusive, its chaotic variability defeating even the most sophisticated initialized climate models.
The research draws on the Decadal Climate Prediction Project, part of the sixth phase of the Coupled Model Intercomparison Project, known as CMIP6. The team assembled a multi-model ensemble of five forecast systems built from three underlying models — EC-Earth3, deployed with three different initialization strategies, along with IPSL-CM6A-LR and MPI-ESM1.2-HR. Unlike long-term climate projections, which start from arbitrary atmospheric conditions, decadal predictions are initialized with the observed state of the ocean and atmosphere, allowing them to capture slow-moving modes of natural variability that unfold over years to decades. The researchers focused on forecast years one through three, a horizon that sits in a genuine gap in the climate services landscape: seasonal forecasts cover the coming months, and century-scale projections inform strategic planning, but the intermediate window relevant for maintenance scheduling, year-ahead production estimates and seasonal energy-mix management has remained largely unexploited.
To make the raw model output useful for the energy sector, the team applied a careful chain of technical processing. Model data were statistically downscaled to the 0.25-degree grid of the ERA5 reanalysis, the observation-based reference dataset widely used by the energy community, through spatial interpolation followed by calibration with Empirical Quantile Mapping. This method adjusts the full statistical distribution of each variable — mean, variance and higher-order moments — at 1 percent quantile intervals, using a 30-day moving window to preserve seasonality. Crucially, everything was performed within a leave-one-year-out cross-validation framework, ensuring that no information from the target year leaked into the calibration and inflating the apparent skill. For wind, surface speeds were extrapolated to the 100-meter hub height typical of modern turbines using a power law with shear exponents of 0.143 over land and 0.11 over water, and the ERA5 winds themselves were corrected against the Global Wind Atlas to better represent long-term mean conditions.
From these calibrated climate variables, the researchers computed three energy-relevant indicators. Photovoltaic potential, or PVpot, is a dimensionless metric combining surface downwelling shortwave radiation, near-surface air temperature and surface wind speed, capturing how efficiently solar panels convert sunlight under real ambient conditions — hotter cells are less efficient, and convective cooling by wind can partially offset those thermal losses. The wind capacity factor, WCF, measures the ratio of actual energy produced to the theoretical maximum of continuous rated operation, derived from the nonlinear power curves of International Electrotechnical Commission Class I turbines using six-hourly wind data to preserve the variability that daily averaging would smear away. The third indicator is the most innovative: the number of energy drought days, or NED, counting days on which neither wind nor solar resources produce efficiently — a compound metric designed to flag the simultaneous deficits that can stress an electricity system most severely.
The headline result concerns solar. PVpot showed the highest and most spatially homogeneous predictive skill of all three indicators, with significantly positive anomaly correlation coefficients across large parts of Europe in the annual mean and during spring and summer. In summer, positive skill extended over most of the domain, while winter proved the weakest season, with significant skill confined mainly to parts of Iberia and Italy. This pattern closely mirrors the behavior of surface solar radiation itself, the dominant driver of photovoltaic performance, which is strongly constrained by large-scale energy balances and therefore inherently more predictable than fast-moving atmospheric circulation. The skill of PVpot fell slightly below that of radiation alone, reflecting the secondary influence of temperature and wind, but the overall message was clear: for solar, the coming three years are largely foreseeable, and the annual mean benefits from the dominant contribution of the high-radiation seasons, which boosts the signal-to-noise ratio.
Wind told a very different story. The wind capacity factor displayed low and spatially fragmented skill, consistent with the high intrinsic variability of near-surface winds and their sensitivity to synoptic-scale weather systems that evolve on timescales far shorter than the forecast horizon. Significant skill appeared most consistently over eastern Europe across seasons, with additional pockets over parts of southern France, Iberia in winter, and central Europe in summer. The researchers note that this is physically expected: variables governed by slow energy balances, such as temperature and radiation, tend to be predictable, whereas winds and precipitation, driven by regional and synoptic processes, carry far larger uncertainty. The spatial pattern of WCF skill closely tracked that of surface wind speed itself, confirming wind variability as the primary bottleneck for predictability.
A key methodological innovation was the explicit separation of total predictive skill from the added value of model initialization. The team compared the initialized decadal predictions against non-initialized historical forcing simulations using the residual correlation, or ResCorr, which linearly removes the variability already captured by the historical runs before correlating the remainder. Positive ResCorr values indicate that initialization captures observed variability that the historical simulations miss. For PVpot, initialization delivered significantly positive added value across large parts of the domain in the annual mean and especially in summer. For wind, the impact was weaker and regionally scattered, with the clearest enhancements over eastern Europe in summer. The authors also confronted a subtle statistical trap: because the historical ensembles contain few members, the standard ResCorr can carry a positive bias that overestimates the benefit of initialization. Their bootstrap-based bias correction, repeated 5,000 times, substantially reduced some of the strongest ResCorr signals, and the team urges caution in interpreting both estimates.
The compound energy drought indicator revealed perhaps the most operationally interesting behavior. NED skill was highest in summer, when predictability was largely controlled by solar conditions, and lowest in winter and autumn, when wind dominates. This seasonal switching means that forecast quality for compound events depends on which resource is the limiting factor at a given time of year — and since solar is the more predictable source, energy droughts are most foreseeable precisely when they are climatologically rare. Regional trend analysis added further nuance: in summer, both the reanalysis and the decadal predictions showed significant negative trends in energy drought days over Iberia, Western Europe, the Mediterranean and central and eastern Europe, driven mainly by increasing solar effectiveness, and these shared trends translated into significantly positive correlations. In winter, by contrast, solar effectiveness is negligible over much of Europe and drought-day variability is governed almost entirely by wind, where skill collapses.
The study also uncovered a sobering signal for the wind industry. The decadal predictions exhibited predominantly negative trends in wind capacity factor across all European regions and seasons, and where the ERA5 reanalysis showed coherent negative trends — most notably over eastern Europe — the forecasts achieved their best regional correlations. This pattern aligns with earlier CMIP6-based analyses reporting historical wind speed declines over Europe and with projections of weakening near-surface winds later this century, suggesting that a tendency toward declining wind resources may already be weakly emerging in the observational record, even though the magnitude and spatial structure of historical wind changes remain contested among datasets.
The authors are candid about limitations: ERA5 is the sole reference dataset, the power-law extrapolation to hub height assumes neutral atmospheric stability, and fixed efficiency-based thresholds may not transfer across technologies. Correlation-based metrics also say nothing about forecast reliability or the representation of extremes. Yet the overall conclusion is actionable and timely. Decadal predictions can already provide meaningful, skill-assessed guidance for solar planning across much of Europe, particularly for year-ahead and multi-year horizons, while wind applications demand more caution and region-specific assessment. As Europe’s decarbonization targets accelerate the deployment of renewables, knowing precisely where and when three-year climate forecasts can be trusted is itself a form of infrastructure — one that this study has, for the first time, mapped indicator by indicator, season by season, and region by region.
Subject of Research: Decadal climate prediction skill for European wind, solar and compound renewable energy indicators
Article Title: Decadal predictions of wind, solar and compound power indicators to support the European renewable energy sector
Article References: Moreno-Montes, S., Delgado-Torres, C., Olmo, M., Ghosh, S., Torralba, V., & Soret, A. (2026). Decadal predictions of wind, solar and compound power indicators to support the European renewable energy sector. Earth System Dynamics, 17(5), 1435-1454. https://doi.org/10.5194/esd-17-1435-2026
Image Credits: AI Generated
Keywords: decadal prediction, renewable energy, solar power, wind power, energy droughts, CMIP6, DCPP, Europe, climate services, photovoltaic potential, wind capacity factor, ERA5
Cite Scienmag News
Violet Maxwell. (October 8, 2026). Solar power is predictable years ahead, but wind still defies Europe’s decadal forecasts. Scienmag. https://scienmag.com/solar-power-is-predictable-years-ahead-but-wind-still-defies-europes-decadal-forecasts/
Violet Maxwell. "Solar power is predictable years ahead, but wind still defies Europe’s decadal forecasts." Scienmag, 8 October 2026, https://scienmag.com/solar-power-is-predictable-years-ahead-but-wind-still-defies-europes-decadal-forecasts/. Accessed 8 October 2026.
Violet Maxwell. "Solar power is predictable years ahead, but wind still defies Europe’s decadal forecasts." Scienmag. October 8, 2026. https://scienmag.com/solar-power-is-predictable-years-ahead-but-wind-still-defies-europes-decadal-forecasts/


