When a deadly heatwave scorches Europe, the question that follows almost immediately is whether climate change caused it. For two decades, the young science of extreme event attribution has answered that question event by event, comparing the odds of a specific heatwave in a world with human greenhouse gas emissions against a hypothetical world without them. Now a team of statisticians and climate scientists at the University of Bonn has pushed the approach much further, developing a method that attributes not just a single event but entire summer time series, heat extremes and ordinary days alike, to anthropogenic forcing. Their conclusion is striking: judged with today’s knowledge and today’s data, the human fingerprint on European heatwaves could already have been proven decisively in the 1960s, and twenty-first-century European heatwaves are very likely impossible without those emissions.
The study, published in the journal Advances in Statistical Climatology, Meteorology and Oceanography by Pascal Meurer, Sebastian Buschow, Svenja Szemkus and Petra Friederichs, tackles a blind spot in conventional attribution. Most attribution analyses compress a sprawling, spatially extended heatwave into a single number, such as a regional average temperature, and then apply univariate extreme value statistics. In doing so they discard the temporal structure of the event, the fact that extreme heat persists for days, that heatwaves unfold as sequences of hot days and nights, and that this persistence is central to their impact on human health, agriculture and infrastructure. The Bonn team set out to build an attribution framework that keeps that temporal dependence intact and can even attribute summers that mix heat extremes with cold spells, such as the varied European summer of 2025.
The first challenge is dimensionality. Daily maximum temperature over Europe is a vast spatial field, and an attribution method that must evaluate probabilities for extremes cannot handle thousands of grid points at once. The researchers therefore condense the spatial information using the extremal pattern index, or EPI, a tool developed by Szemkus and Friederichs in 2024. The method is a cousin of principal component analysis, but instead of decomposing ordinary correlations it decomposes the dependence between extremes. Temperature anomalies are first transformed to a standard Fréchet distribution, a mathematical step that deliberately gives most weight to large positive anomalies and little weight to small or negative ones. A tail pairwise dependence matrix is then built from all pairs of land grid points, and its eigenvectors reveal spatial patterns where extremes tend to occur together. Projecting each day’s temperature field onto the ten leading extremal patterns yields a single daily number, the EPI, which summarises how strongly a large-scale extreme heat pattern is active. In southern Europe, these ten patterns capture roughly seventy-five percent of the variance of the Fréchet-standardised extremes.
With the spatial field compressed into a daily time series, the team models the sequence of EPI values across each summer as a first-order Markov process, meaning that the state of any given day depends statistically on the previous day. The crucial innovation lies in how the extremes are handled. Rather than the traditional practice of declustering, in which consecutive threshold exceedances are collapsed into a single cluster maximum to manufacture independence, the researchers model the dependence directly using bivariate extreme value theory. Pairs of consecutive days are described by a joint distribution whose margins follow a generalised Pareto distribution above a high threshold, the standard peaks-over-threshold framework, while the dependence between the two days is captured by a stable tail dependence function, here the simple logistic model with a single parameter. A censored likelihood scheme divides the two-dimensional plane into four regions depending on whether each day exceeds the threshold, so that non-extreme observations contribute only the probability of not exceeding, and the estimation of extremal dependence remains untainted by ordinary weather.
Because the climate is not stationary, the model must also evolve. The parameters of the marginal distribution, the exceedance probability, the scale and the shape of the generalised Pareto distribution, and the day-to-day dependence parameter are all allowed to change slowly over time, described by low-order Legendre polynomials that are orthogonal, smooth and independent of the data. The team implements two complementary formulations. In the first, the threshold is held fixed at the ninety-fifth percentile and the exceedance probability is modelled with logistic regression, so that a warming world shows up as a rising probability of crossing the same line. In the second, the exceedance probability is fixed and the threshold itself is allowed to drift, estimated by quantile regression, so that the general warming trend is absorbed into a moving baseline. This second formulation answers a subtly different question: is there any climate change signal in the tail behaviour of heatwaves beyond the simple shift of the whole temperature distribution?
Attribution then proceeds through a likelihood ratio grounded in causal counterfactual theory. The researchers fit the non-stationary Markov model separately to two families of climate simulations from the CMIP6 archive: the historical scenario with both natural and anthropogenic forcing, extended after 2014 by the SSP2-4.5 scenario, and the historical-natural scenario in which greenhouse gases and aerosols from human activity are removed and only solar and volcanic drivers remain. The likelihood of the observed EPI time series from the ERA5 reanalysis, which provides a consistent picture of the atmosphere since 1940, is then evaluated under each scenario. Because summers are treated as independent, the seasonal likelihood ratios multiply into a Bayes factor, and the accumulated evidence over any span of summers can be tracked from 1940 to the present. Uncertainty is handled by bootstrapping ensemble members within each climate model, and the log-likelihood ratios from different models are combined with a random-effects meta-analytic model that separates natural variability from model uncertainty.
The results are unambiguous for the first attribution question. The full record of European summers from 1940 to 2025 is attributed to the scenario with anthropogenic emissions with decisive evidence in every region examined, northern, central and southern Europe. In the southern European region, the accumulated Bayes factor after the summer of 2025 reaches roughly 2.25 times ten to the power of twenty-six, meaning the observed summers are that many times more probable under the world with human emissions than under the counterfactual natural-only world. More remarkable still is the timing: with a fixed threshold, the level of decisive evidence was already crossed in 1962 for central Europe and 1964 for southern Europe. Individual recent summers stand out sharply, with 2010, 2018 and 2022 providing strong evidence even on their own in northern Europe, and the scorching southern European summer of 2025, in which nearly half the days exceeded the ninety-fifth percentile of the EPI, falling into the decisive category. Interestingly, the summer of 2025 did not top the list despite the exceptional Scandinavian heatwave, because the method attributes the entire season, and a relatively cool June diluted the evidence compared with attribution studies that examined only the hot July phase.
The answer to the second question is more nuanced and, in a sense, reassuring in one narrow respect. When the warming trend is absorbed into a time-varying threshold, the likelihood ratios of most recent summers hover around one, indicating no detectable signal beyond the shift of the distribution. In the anthropogenic simulations, the shape parameter of the exceedance distribution trends negative after 2010, which would imply a bounded upper limit on temperatures relative to the shifted baseline, but this tendency is not reproduced in the ERA5 observations and may be an artefact of the climate models. In other words, relative to a moving baseline, the tail behaviour of heatwave extremes has not changed in a consistent, detectable way. The authors are careful to stress that this statement does not contradict the first finding: the increasing frequency and intensity of European heatwaves remains a robust and decisive result, and the dependence between consecutive hot days has clearly strengthened over time, reflecting longer and more persistent heatwaves.
The broader significance of the work extends beyond the headline numbers. By adapting the censored threshold model for extremes to non-stationary conditions, the Bonn team has created a framework that can attribute any stretch of time, from a single summer to a multi-decade record, and that is less dependent on how an event is defined than conventional approaches. The method also doubles as a test of climate models themselves: comparing the non-stationary parameter estimates from CMIP6 simulations with those from ERA5 reveals how faithfully the models reproduce the historical evolution of temperature extremes, and the historical simulations generally track the observed trends well. As warming accelerates and non-stationarity intensifies, the authors argue, sophisticated statistical machinery of this kind will become essential for evaluating extremes in both past and future climates, complementing the rapid-response analyses of the World Weather Attribution with a perspective that captures the full temporal texture of a heatwave rather than a single compressed snapshot.
Subject of Research: Non-stationary time series attribution of European heatwaves to anthropogenic climate forcing
Article Title: Non-stationary time series attribution for heatwaves over Europe
Article References: Meurer, P., Buschow, S., Szemkus, S., & Friederichs, P. (2026). Non-stationary time series attribution for heatwaves over Europe. Advances in Statistical Climatology, Meteorology and Oceanography, 12(2), 243-274. https://doi.org/10.5194/ascmo-12-243-2026
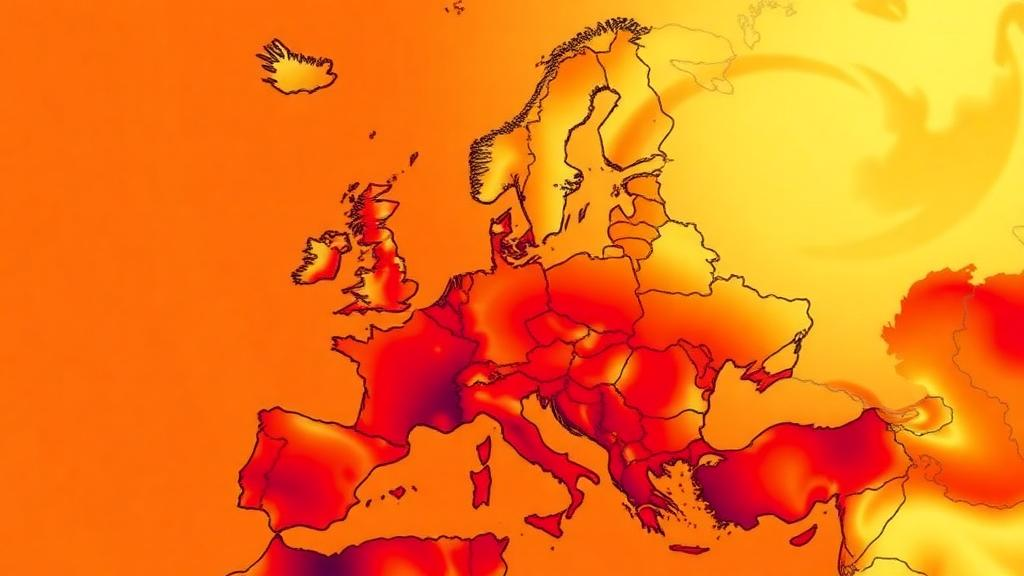
Image Credits: AI Generated
DOI: 10.5194/ascmo-12-243-2026
Keywords: heatwaves, extreme event attribution, climate change, extreme value theory, Markov process, CMIP6, ERA5, Europe, Bayes factor, non-stationarity, greenhouse gases, statistical climatology
Cite Scienmag News
Todd Mitchell. (October 8, 2026). New Statistical Method Shows Human-Caused Heatwaves Were Detectable in Europe by the 1960s. Scienmag. https://scienmag.com/new-statistical-method-shows-human-caused-heatwaves-were-detectable-in-europe-by-the-1960s/
Todd Mitchell. "New Statistical Method Shows Human-Caused Heatwaves Were Detectable in Europe by the 1960s." Scienmag, 8 October 2026, https://scienmag.com/new-statistical-method-shows-human-caused-heatwaves-were-detectable-in-europe-by-the-1960s/. Accessed 8 October 2026.
Todd Mitchell. "New Statistical Method Shows Human-Caused Heatwaves Were Detectable in Europe by the 1960s." Scienmag. October 8, 2026. https://scienmag.com/new-statistical-method-shows-human-caused-heatwaves-were-detectable-in-europe-by-the-1960s/